Stock Market Trend update 2023
also #stockmarketcrash2023 update 🧵
also #stockmarketcrash2023 update 🧵
In this thread will share an account of trend reversals, chart setups and my thought process in 2023.
So I have not been bearish from the last week but from the very start of the year when everyone were expecting " ALL TIME HIGH " and 19,000 on nifty and -20,000 on Nifty.

So I have not been bearish from the last week but from the very start of the year when everyone were expecting " ALL TIME HIGH " and 19,000 on nifty and -20,000 on Nifty.


First even I had the perception that markets will breakout and we may see a ferocious rally but once charts started becoming bearish and SLs got hit , I changed my view from bullish to bearish. 

At that time also people had to say why you took the u turn from bullish to bearish.
But what to do
That's the market's command.
They say trend is your friend and be with your friend and some friends also experience mood swings.
Markets behaved in the same manner- volatile.

But what to do
That's the market's command.
They say trend is your friend and be with your friend and some friends also experience mood swings.
Markets behaved in the same manner- volatile.


Still less people believed me and they continued to go into the budget with bullish expectation.
On the budget day , I clearly outlined the resistance zone .
Market fell from 42,016 to 39484 the same day.

On the budget day , I clearly outlined the resistance zone .
Market fell from 42,016 to 39484 the same day.


Prior to this as well
almost at heights of euphoria.
This thought stuck my mind-
Sell your PSU BANK stocks and run away?
When PSU bank index was 4550 on 14th dec
Exactly the next day
The top was made at 4617
From there index corrected 23% and stocks corrected even 30-50%

almost at heights of euphoria.
This thought stuck my mind-
Sell your PSU BANK stocks and run away?
When PSU bank index was 4550 on 14th dec
Exactly the next day
The top was made at 4617
From there index corrected 23% and stocks corrected even 30-50%


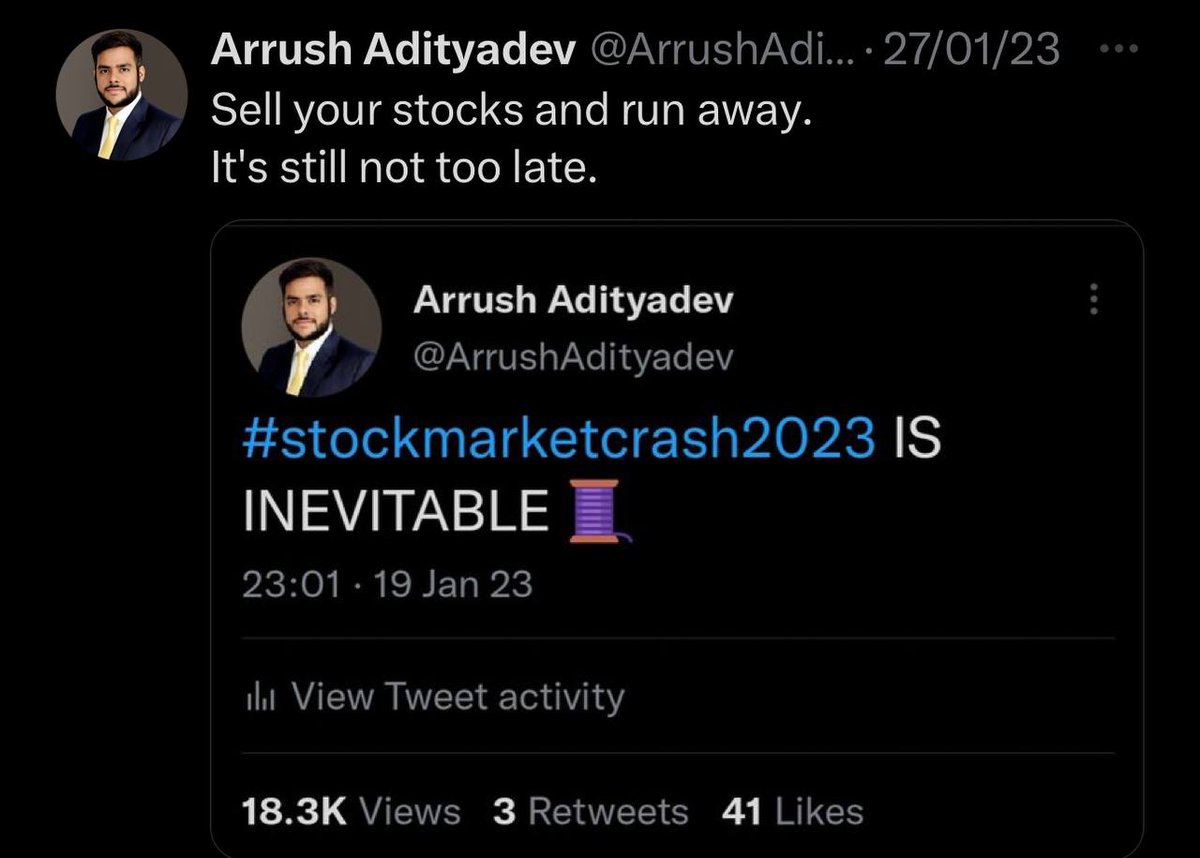
Despite my alert on 19th jan ,
Again I felt the need to communicate with my followers on 27th Jan ,Just before the budget
Time to Sell your stocks and run away ??, still not too late
From there also ,after consolidation we saw breakdown and those who followed, got saved

Again I felt the need to communicate with my followers on 27th Jan ,Just before the budget
Time to Sell your stocks and run away ??, still not too late
From there also ,after consolidation we saw breakdown and those who followed, got saved


Thereafter saw the bearish signs in Adani stocks,
Shared with everyone beforehand!
The breakdown & distribution can be seen in Adani group stocks
The poster boy of d current bull market.
Post d alert ,
Adanient fell from 3463 to 1000
Atgl from 3800 to 678
same damage in others
Shared with everyone beforehand!
The breakdown & distribution can be seen in Adani group stocks
The poster boy of d current bull market.
Post d alert ,
Adanient fell from 3463 to 1000
Atgl from 3800 to 678
same damage in others

I didn't stop here ,because market didn't stop here.
At the same time, US Markets also started breaking down ,more particularly the banks
At the same time, US Markets also started breaking down ,more particularly the banks

At this point in time Breakdowns were abundant ,now evident in the large caps as well.
In finance sector
Charts were bearish ,bajfinance showed the most bearish signals.
Charts suggested bearish signs in bajfinance at 5900, I communicated the same with everyone.
Thereafter it didn't go down straight away but gave a chance even at 6400 now trading at 5500- 5600
Charts were bearish ,bajfinance showed the most bearish signals.
Charts suggested bearish signs in bajfinance at 5900, I communicated the same with everyone.
Thereafter it didn't go down straight away but gave a chance even at 6400 now trading at 5500- 5600

Then the big damage actually came in TCS
Signs of the breakdown came at 3487
I shared with my twitter family
It eventually came down to 3093
Chart attached below

Signs of the breakdown came at 3487
I shared with my twitter family
It eventually came down to 3093
Chart attached below


Then came the march series and everyone said nifty has never closed in negative for straight 4 months.
and expectations were of a positive closing .
I alerted my followers to stay cautious in the longs and
downside levels may come in nifty.

and expectations were of a positive closing .
I alerted my followers to stay cautious in the longs and
downside levels may come in nifty.


The final blow came in march when everyone threw in their towel.
We saw big breakdown in popular names like
IEX
IRCTC
Godrej properties
tata power
laurus labs
and what not.

We saw big breakdown in popular names like
IEX
IRCTC
Godrej properties
tata power
laurus labs
and what not.


This times
Global macro environment was bad
market breadth was bad
large caps were breaking down
The most critical level to watch out was 16800.
If broken,would have created Panic in the market and targets were 16000-15000 in no time.
In Good Faith I alerted my followers again.
Global macro environment was bad
market breadth was bad
large caps were breaking down
The most critical level to watch out was 16800.
If broken,would have created Panic in the market and targets were 16000-15000 in no time.
In Good Faith I alerted my followers again.

If this breakdown would have happened then investors would have had the privilege to stay away from the carnage which might have taken few weeks and months.
And market would have offered the opportunity on a silver platter to buy investor favourite stock at the discounted price.
And market would have offered the opportunity on a silver platter to buy investor favourite stock at the discounted price.
They say - Sell in may and go away, but April and may both were on verge of bearish months.
Hence sell and run away and don't look back for few weeks and months but come back later when there may be fire sale and things look good.
Hence sell and run away and don't look back for few weeks and months but come back later when there may be fire sale and things look good.
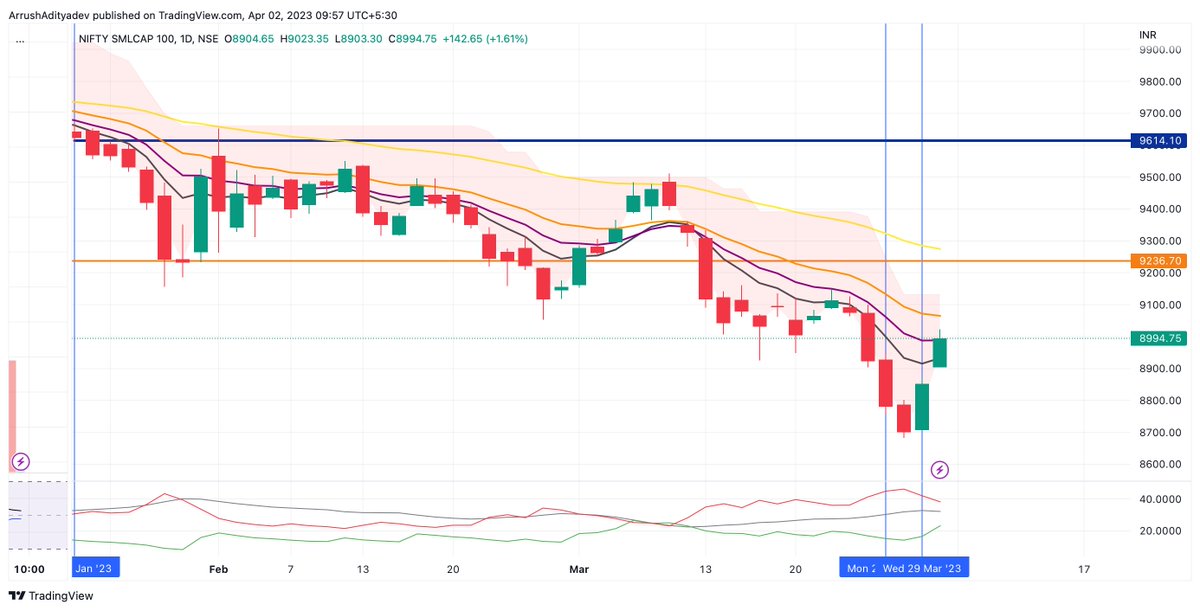
Market reversed after falling for 1 day ,
I shared technical insights again.
I shared bearish view below 16800 and
have no bearish view or have bullish view above 16800


I shared technical insights again.
I shared bearish view below 16800 and
have no bearish view or have bullish view above 16800


Now markets have rebounded strongly from that mark.
Keeping all the theories aside,
The Lakshman Rekha for the market is 16800
If broken again then markets can slide to lower levels
If not then its an opportunity to accumulate sector leaders for the long run.
Keeping all the theories aside,
The Lakshman Rekha for the market is 16800
If broken again then markets can slide to lower levels
If not then its an opportunity to accumulate sector leaders for the long run.
Those who have followed my views from the very beginning have nothing to regret,
Those who have FOMO bcoz of this 2 day rally then they must not regret because such swing opportunities keep coming frequently.
Market is a regret machine, control the emotions, wait for ur reward!
Those who have FOMO bcoz of this 2 day rally then they must not regret because such swing opportunities keep coming frequently.
Market is a regret machine, control the emotions, wait for ur reward!
Those who are long term investors and those who believe nifty will hit new highs like 30k-50k in next 10 years, They still have the opportunity to buy truck loads of their favourite share at discounted price.
My view is market will still remain very range bound till election 2024, although range can be very big. as big as 10%.
Hence it is still advisable to not take excessive risk as market direction is still not clear.
Macros are still the same.
Hence it is still advisable to not take excessive risk as market direction is still not clear.
Macros are still the same.
My final take- I have my own share of rights & wrongs, many times even I go wrong so u must take that into the account.
But at the End of the day
I always try to share the major trends with my followers "in advance", "Always in Good Faith" ,with "Honesty "and at "Free of cost".
But at the End of the day
I always try to share the major trends with my followers "in advance", "Always in Good Faith" ,with "Honesty "and at "Free of cost".
Your negative and positive feedbacks are welcome!
• • •
Missing some Tweet in this thread? You can try to
force a refresh


