Jason Furman Profile picture
Apr 3, 2023 7 tweets 3 min read Read on X
I didn't get a chance to tweet the PCE price & other data on Friday (too busy with carbon taxes!). Sharing data now.

Core PCE inflation came in below expectations and below recent trends.

But is volatile, overall has moved sideways.

Underlying inflation remains about 4.5%...
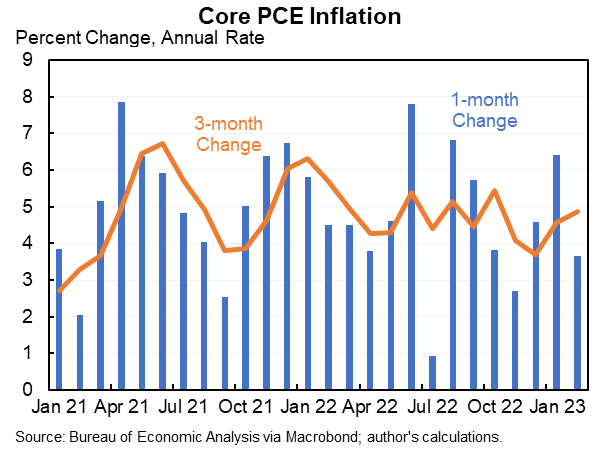
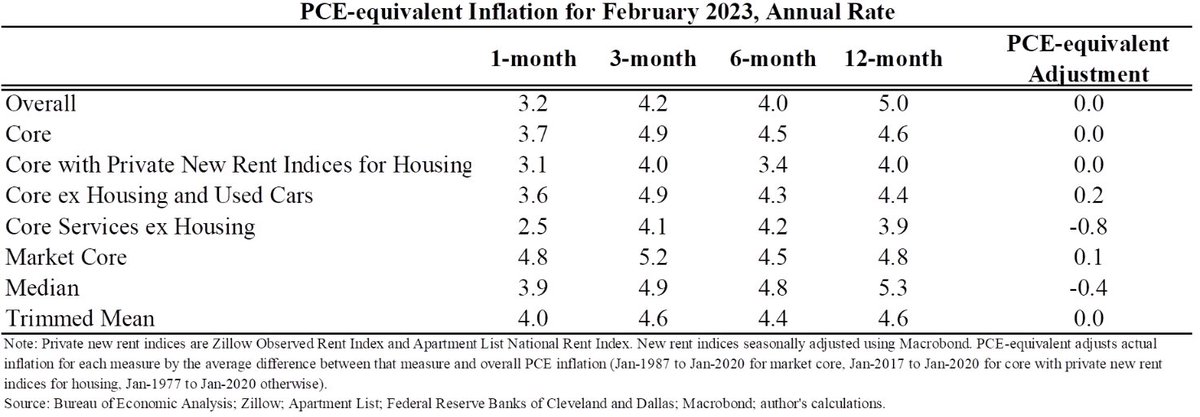
...Here are 8 different measures of inflation for 4 different periods. I'm adjusting to PCE-equivalent (mostly matters for core services ex housing and median which run higher on average).

Ignoring volatile 1 month, these range from 3.4% to 5.3% with a median of 4.5%.
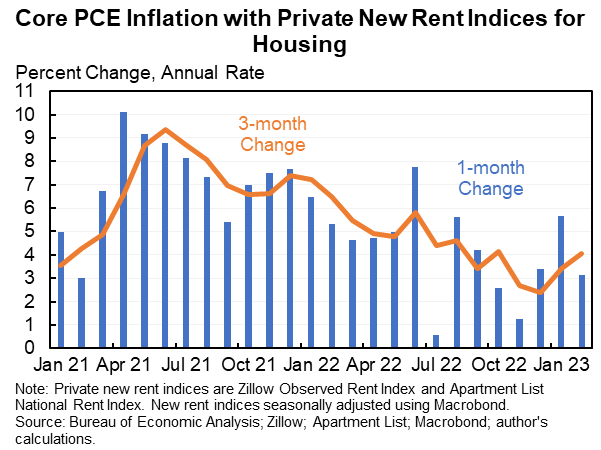
Notably, swapping in indices for new rent for the lagged all rent in the official data is making a smaller difference lately.

The 3-month annualized inflation rate with new rent indices is 4.0%, only slightly below the 4.2% for official core.
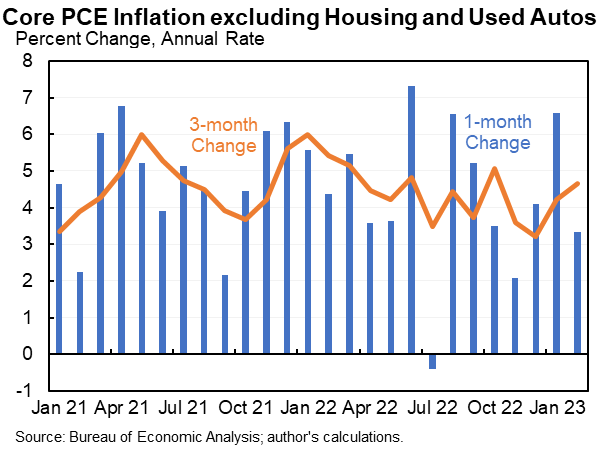
An alternative way to handle housing is simply to exclude it. This reproduces the "supercore" concept by excluding housing and used cars. Like core it has also moved sideways--and is consistent with inflation in the mid-4's.
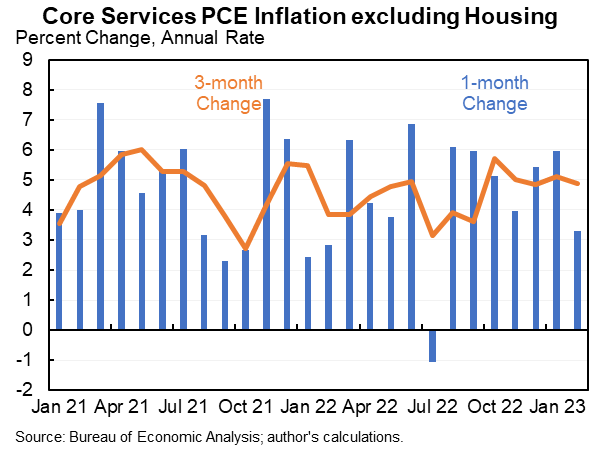
This is the measure the Fed has been focused on, which is core services excluding housing. Like most everything else it improved in February, but like most everything else smoothed over longer periods it has been moving sideways--and is consistent with 4%+ inflation.
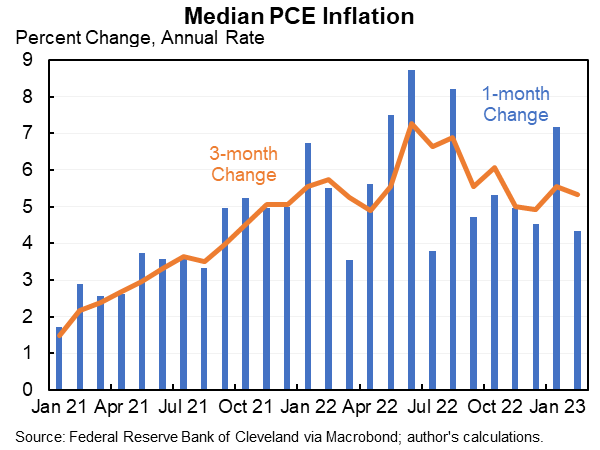
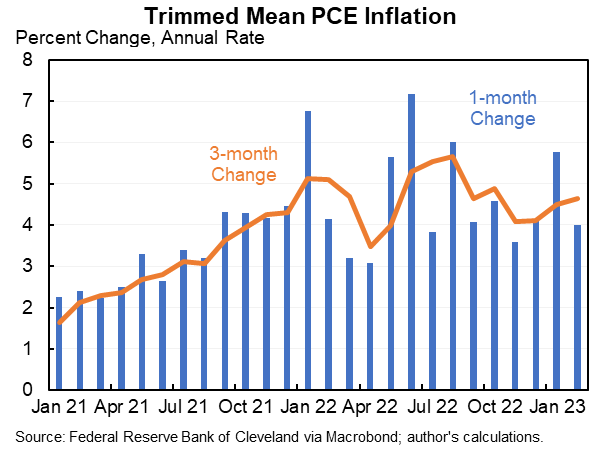
A lot of good empirical reasons to believe the median or trimmed mean are the best measures of core inflation, is telling us more like high 4s than low 4s.
Overall, the PCE price data tell a consistent story (more consistent than the story from the CPI, because housing matters less in the PCE).

No big reason in the price data itself to expect that to change--but external data on growth and wages suggest some possibility of slowing.

• • •

Missing some Tweet in this thread? You can try to force a refresh
 

Keep Current with Jason Furman

Jason Furman Profile picture

Stay in touch and get notified when new unrolls are available from this author!

Read all threads

This Thread may be Removed Anytime!

PDF

Twitter may remove this content at anytime! Save it as PDF for later use!

Try unrolling a thread yourself!

how to unroll video
  1. Follow @ThreadReaderApp to mention us!

  2. From a Twitter thread mention us with a keyword "unroll"
@threadreaderapp unroll

Practice here first or read more on our help page!

More from @jasonfurman

Aug 12
Inflation numbers a little better than expected. But inflation numbers also showing signs of re-inflation, both tariff and possibly otherwise.

Core annual rate:

1 month: 3.9%
3 months: 2.8%
6 months: 2.4%
12 months: 3.1% Image
Here are all the numbers. All of them highly elevated except headline--which benefited from a 2.2% decline in gasoline prices (seasonally adjusted). Image
The overall dynamic is core services inflation has stayed high (and even rose in July) while core goods have gone from deflation to inflation. Image
Read 4 tweets
Aug 1
The jobs slowdown is here with 73K jobs in July & large downward revisions to May & June bringing the average to 35K/month.

Not quite as bad as you might think because steady-state job growth is much lower in a low net immigration world but unemployment still gradually rising. Image
A small portion of the weaker jobs numbers in recent months are Federal cuts. Image
But the bigger issues is the slowdown in private job creation. Image
Read 7 tweets
Jul 31
My latest @nytopinion attempts to answer the question, "The Tariffs Kicked In. The Sky Didn’t Fall. Were the Economists Wrong?"

Part of my argument is the economy actually has slowed & inflation has picked up, as you would expect.

Plus Trump called off some tariffs and lags. Image
But there are two broader lessons here:

1. U.S. economy is mostly domestic services. Trade matters but it doesn't matter as much as some of the hype might make you think. (And I confess, I do suffer from TDS, tariff derangement syndrome.) Image
2. Much of macro is small on a percentage basis. But small things really matter a lot.

0.5% off one year's growth rate and $1,000 per household per year forever are the same. But the former sounds small and the later makes it clear it is a large unforced error. Image
Read 5 tweets
Jul 31
A big pop in core PCE inflation in June. Annual rates:

1 month: 3.1%
3 months: 2.6%
6 months: 3.2%
12 months: 2.8%

No matter what horizon you're looking at this is too high. (Although there is a case that it is transitory due to tariffs.) Image
Here are the full set of numbers. Image
Services excluding housing is the one slice that is muted. But that is what we were counting on to get inflation back to 2%. The problem is goods inflation of this magnitude was not expected (prior to tariffs). Image
Read 8 tweets
Jul 30
Q2 GDP came in at a 3.0% annual rate.

There were massive timing shifts that shifted reported growth from Q1 to Q2. The much better way to look at the data is averaging the two which is a 1.2% annual rate. That is well below the pace in 2024 or the Nov 2024 forecast for 2025-H1. Image
Here are the GDP numbers. In Q1 inventories added 2.6pp but imports subtracted 4.6pp. In Q2 it was the reverse, with inventories subtracting 3.2pp and imports adding 5.0pp. These are volatile categories and inventories, in particular, have large measurement error. Image
Here are those import and inventory numbers. In Q1 firms imported a lot to get ahead of tariffs. Then in Q2 imports fell back down to a more normal pace (about the same as in 2024). A lot of those imports went into inventories in Q1 and came out of them in Q2. Image
Image
Read 8 tweets
Jul 15
Inflation rose in June, with core CPI at an annual rate of:

1 month: 2.8%
3 months: 2.4%
6 months: 2.7%
12 months: 2.9%

You can see signs of tariffs in these numbers and that is only likely to grow. Image
Here are core goods and core services. The service increase is relatively normal (even muted as shelter was low this month). Goods was unusually high including increases in tariffs sensitive items like appliances and apparel. Image
Here are the full set of numbers. Notably everything ex housing is worse for the month of June, a reversal of the pattern we had seen earlier. Image
Read 6 tweets

Did Thread Reader help you today?

Support us! We are indie developers!


This site is made by just two indie developers on a laptop doing marketing, support and development! Read more about the story.

Become a Premium Member ($3/month or $30/year) and get exclusive features!

Become Premium

Don't want to be a Premium member but still want to support us?

Make a small donation by buying us coffee ($5) or help with server cost ($10)

Donate via Paypal

Or Donate anonymously using crypto!

Ethereum

0xfe58350B80634f60Fa6Dc149a72b4DFbc17D341E copy

Bitcoin

3ATGMxNzCUFzxpMCHL5sWSt4DVtS8UqXpi copy

Thank you for your support!

Follow Us!

:(