A simple lesson in identifying your 'range' / 'broadening formation'
Must know what is a swing low or swing high we'd deem as important.
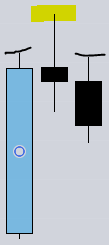
Here is a swing low
Yellow is the 'invalidation' of it if you were taking this hammer signal.
Must know what is a swing low or swing high we'd deem as important.
Here is a swing low
Yellow is the 'invalidation' of it if you were taking this hammer signal.

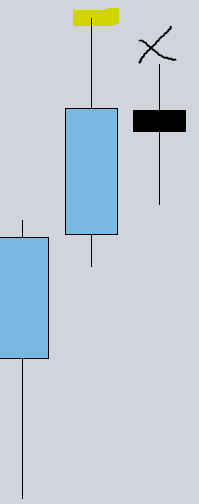
This is also a swing low.

Swing high example
I hope you guys see the #BoxSetup logic & why we like the 15s timeframes just from these alone.
I hope you guys see the #BoxSetup logic & why we like the 15s timeframes just from these alone.
This is the most important part so pay attention.
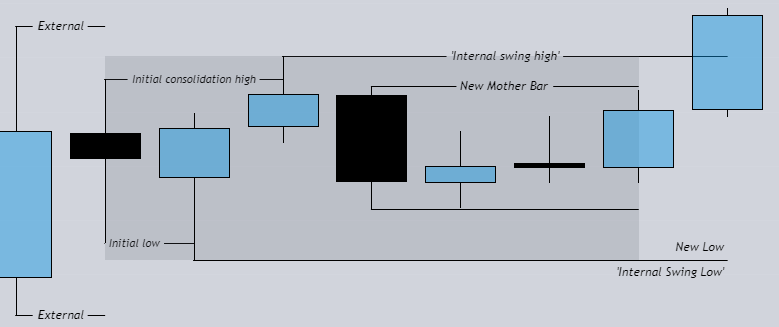
This is not a swing high.
This is a consolidation, this is waiting to decide.
Until the mother bar to this inside bar gets violated on either side I do not consider it a swing high.
This is not a swing high.
This is a consolidation, this is waiting to decide.
Until the mother bar to this inside bar gets violated on either side I do not consider it a swing high.
The second we see new highs occur is when we can then start looking for more 'range' to be put in
This is because when you're stuck in a consolidation you have NO range to target, it is simultaneously creating range and taking out range within a larger range. Aka CHOP SHOP.
This is because when you're stuck in a consolidation you have NO range to target, it is simultaneously creating range and taking out range within a larger range. Aka CHOP SHOP.
Now that we know what a solid swing high and swing low looks like.
How do we actually identify where price is going and which 'pivots' will give good actionable signals?
It's actually really simple!
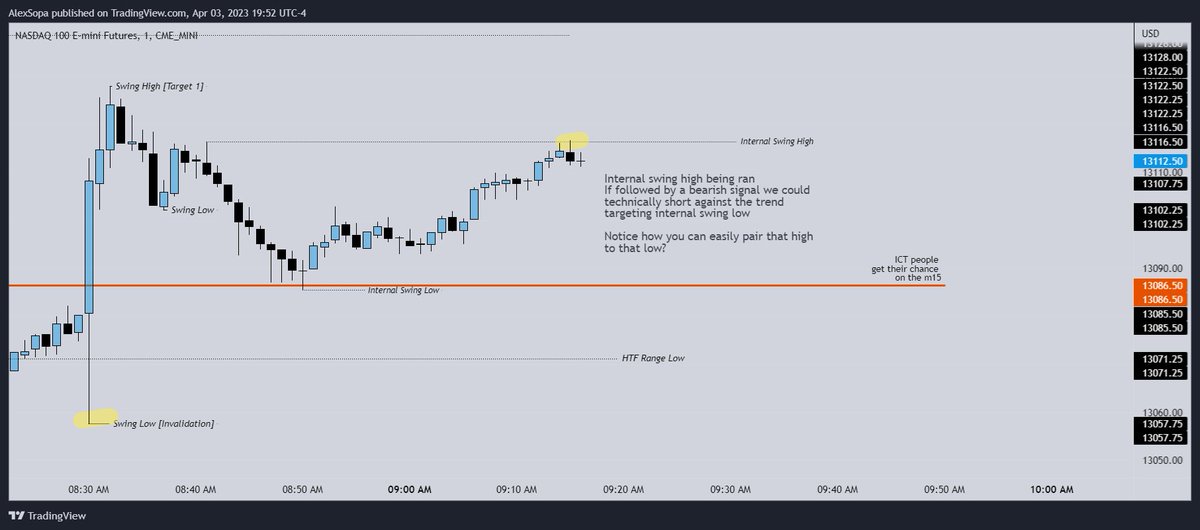
Swing highs and lows get PAIRED together.
How do we actually identify where price is going and which 'pivots' will give good actionable signals?
It's actually really simple!
Swing highs and lows get PAIRED together.
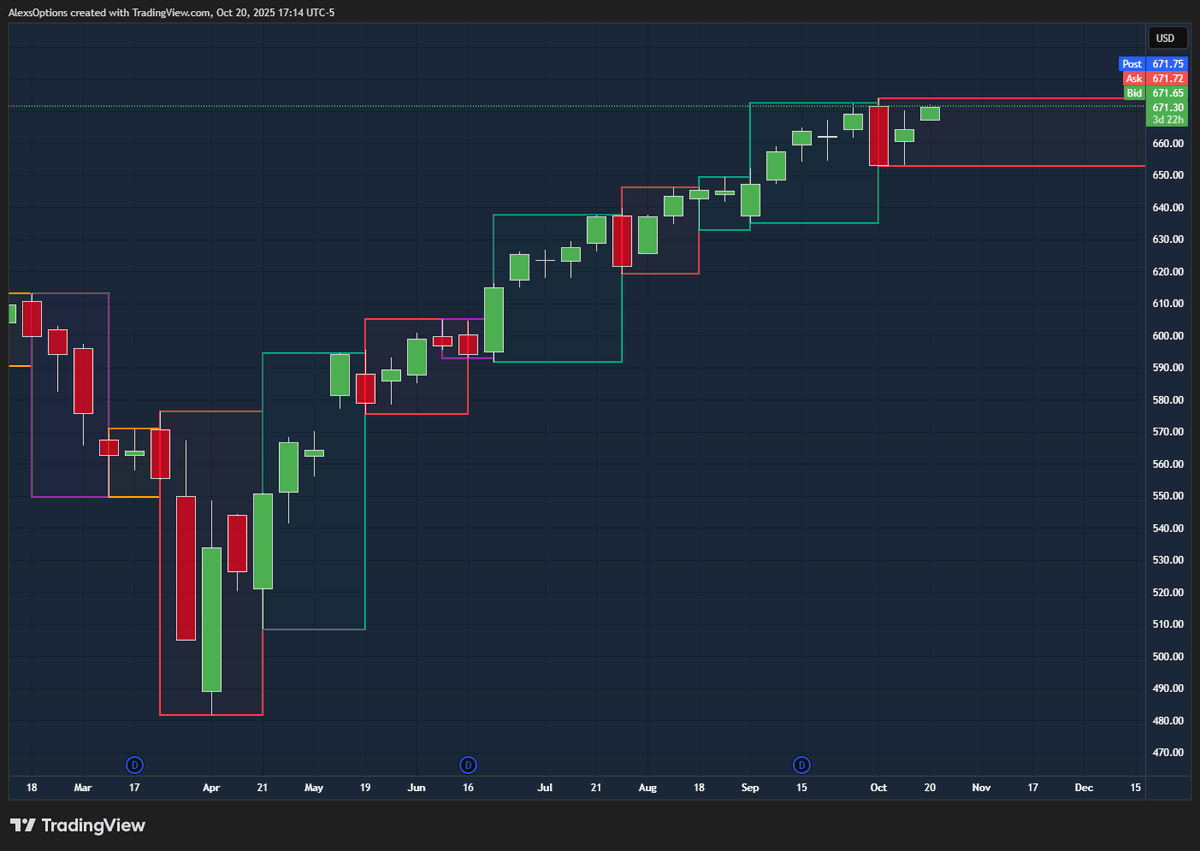
The pairing of the highs and lows is the 'broadening formation magic'.
If we look to the LEFT as much as possible and zoom out we can identify the external areas of the range that will give you the *ACTUAL* move that people talk about all the time.
If we look to the LEFT as much as possible and zoom out we can identify the external areas of the range that will give you the *ACTUAL* move that people talk about all the time.
When people say it's a 'fake' move they are talking about the run into the external range.
That move becomes fake when you take liquidity and create a reversal.
On a HTF it'll be a strat reversal
On a LTF you'll see ICT concepts if the range is large enough
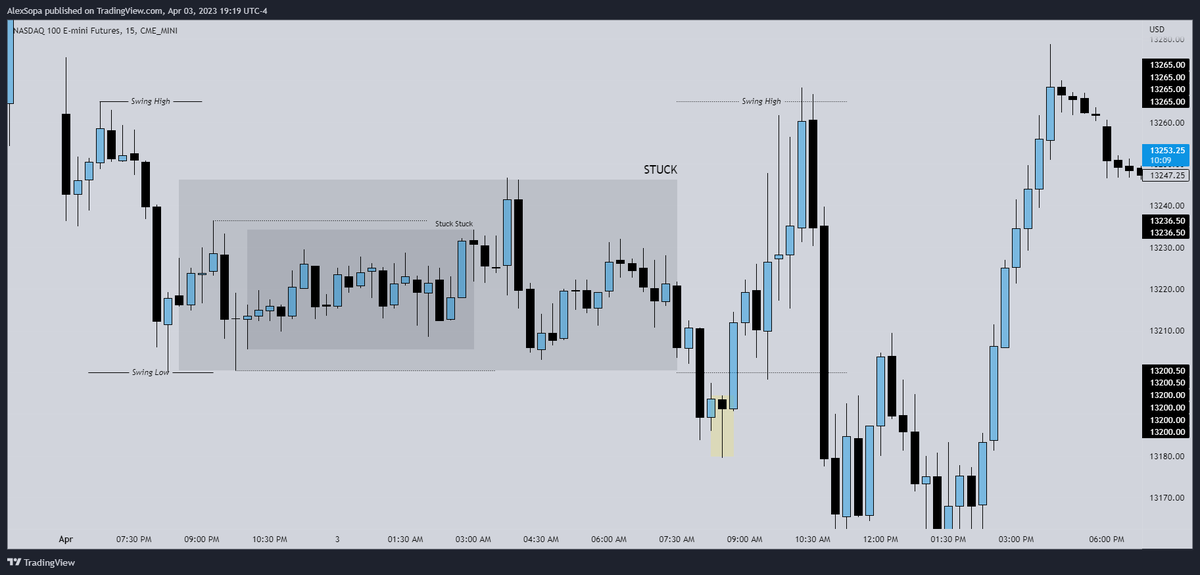
8H NQ STUCK = BF
That move becomes fake when you take liquidity and create a reversal.
On a HTF it'll be a strat reversal
On a LTF you'll see ICT concepts if the range is large enough
8H NQ STUCK = BF
On small range days aka 'seek 'n' destroy' days you're given price action without retracements like today more often than not.
Seek 'n' destroy is an ict coin of a broadening formation.
The funny thing is seek 'n' destroy happens on our larger ranges as well..
Seek 'n' destroy is an ict coin of a broadening formation.
The funny thing is seek 'n' destroy happens on our larger ranges as well..
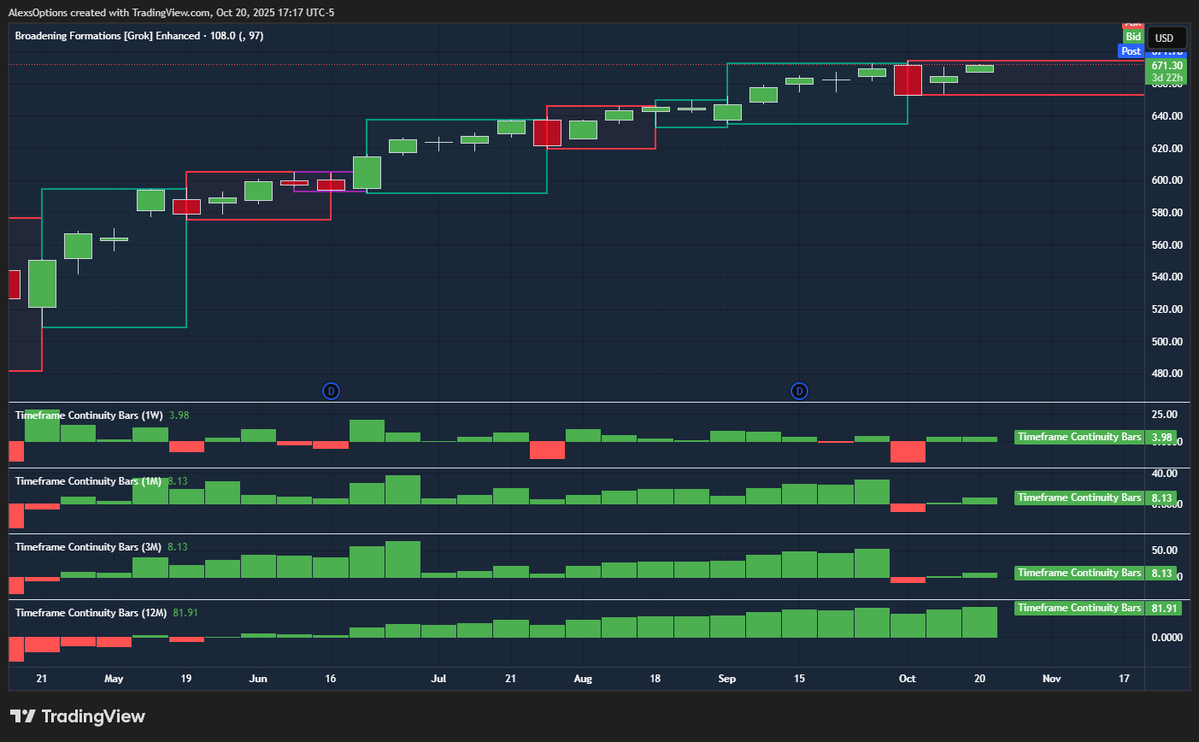
So how do we identify the larger ranges?
The SAME exact way that we identified that smaller consolidation.
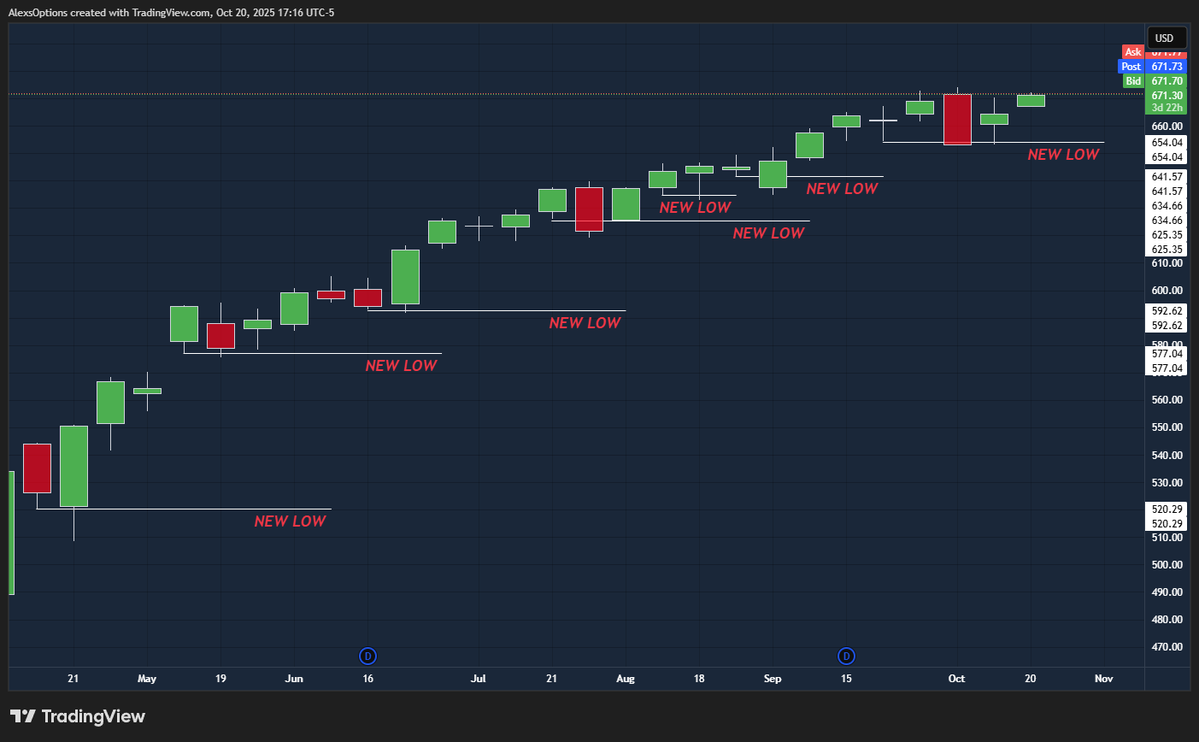
Identify your swing highs and lows
The second we get a candle a penny below we can then look for a reversal signal higher.
The SAME exact way that we identified that smaller consolidation.
Identify your swing highs and lows
The second we get a candle a penny below we can then look for a reversal signal higher.
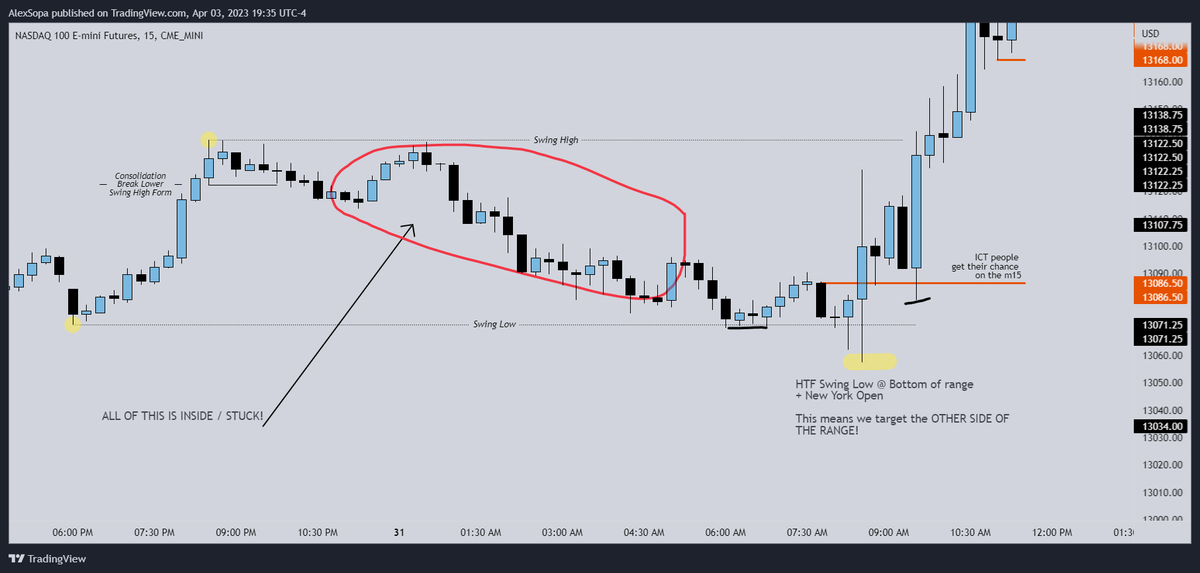
The lower timeframe on this chart is a little bit hard to distinguish so we can bump the timeframe up or down.
Given we expect news / volatility at NY open we should be on LTF with the HTF idea if we want to reduce our risk [at the risk of stopping out more often.
Given we expect news / volatility at NY open we should be on LTF with the HTF idea if we want to reduce our risk [at the risk of stopping out more often.
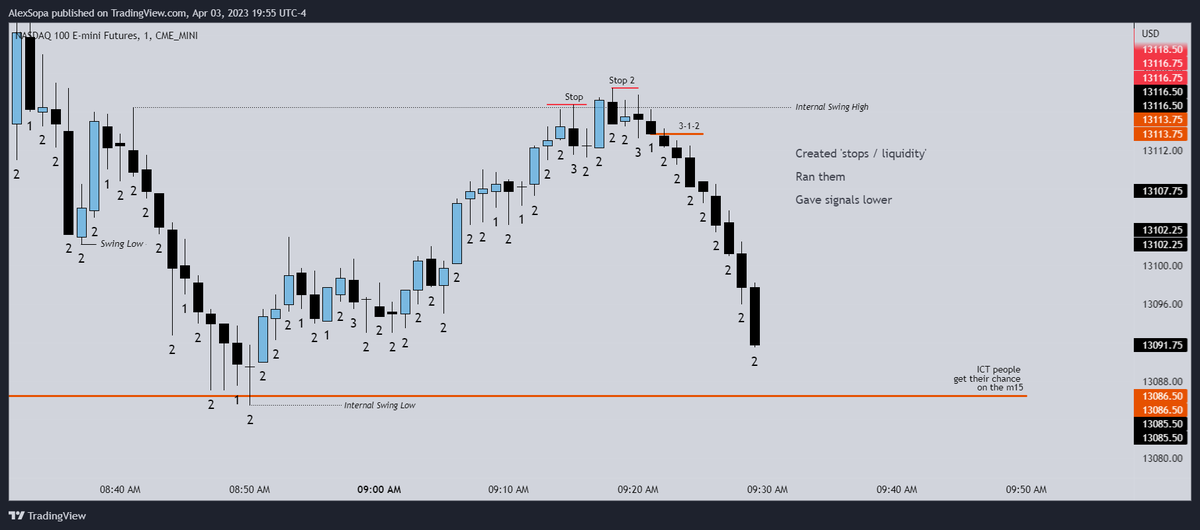
Now I ask you follow the charts and thought process.
Part 1 is where we sit on hands
Part 1 is where we sit on hands
Part 2 is where we still sit on hands
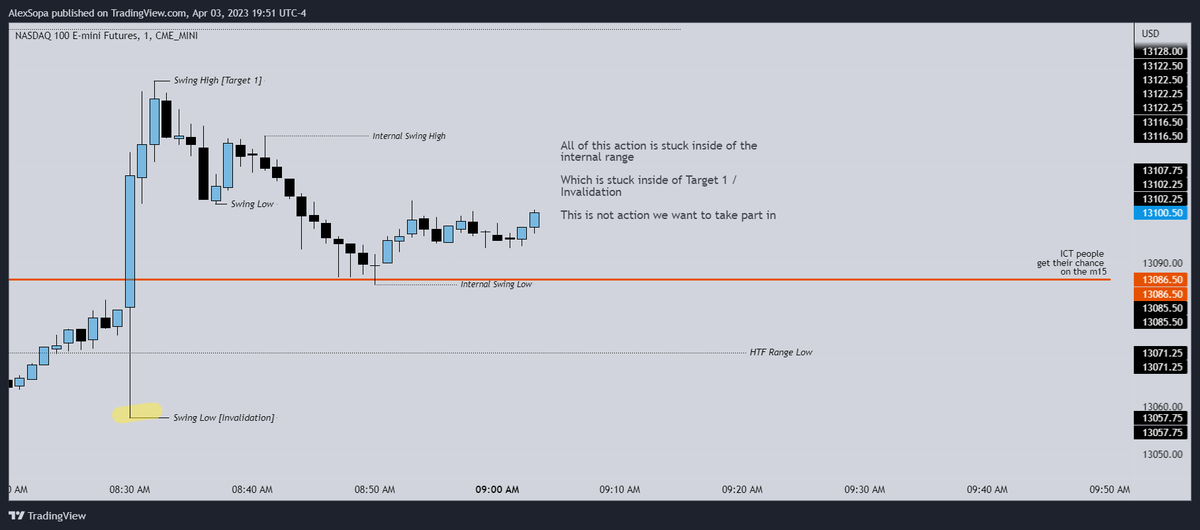
Part three gives you some decent internal range to play.
Notice how there is technically some false 'strat signals'
That's why the stops are tight and why we want actionable signals.
Notice how there is technically some false 'strat signals'
That's why the stops are tight and why we want actionable signals.
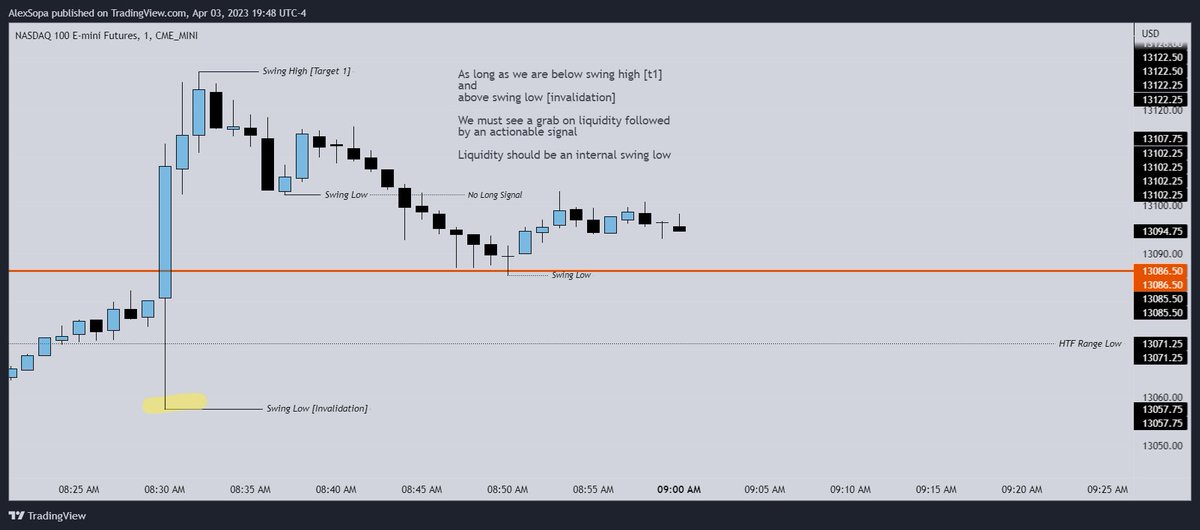
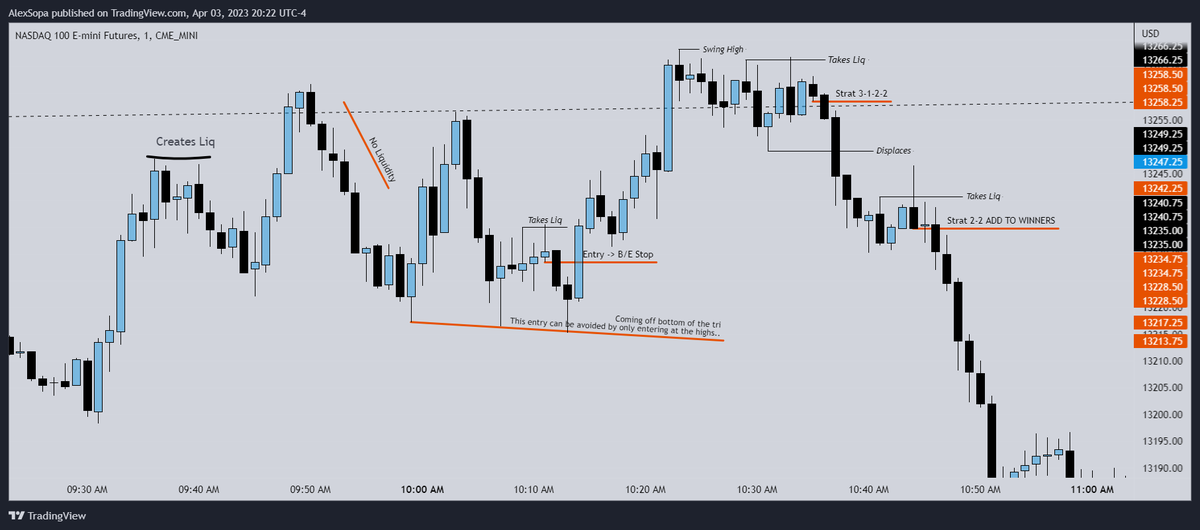
Another thing to add on not getting stopped out of positions as often.
We want to wait for liquidity to be ran on the timeframe we're trading on.
Not always will there be a swing high then new high then reversal but it IS what we want to see.
We want to wait for liquidity to be ran on the timeframe we're trading on.
Not always will there be a swing high then new high then reversal but it IS what we want to see.
The reason we WANT to see that is because it helps us do TWO things.
First it helps us define WHEN we should take action back into the external range.
SECOND it is a 'tell' that the 'new range' is beginning.
Entry model [use ICT or strat entries]
First it helps us define WHEN we should take action back into the external range.
SECOND it is a 'tell' that the 'new range' is beginning.
Entry model [use ICT or strat entries]
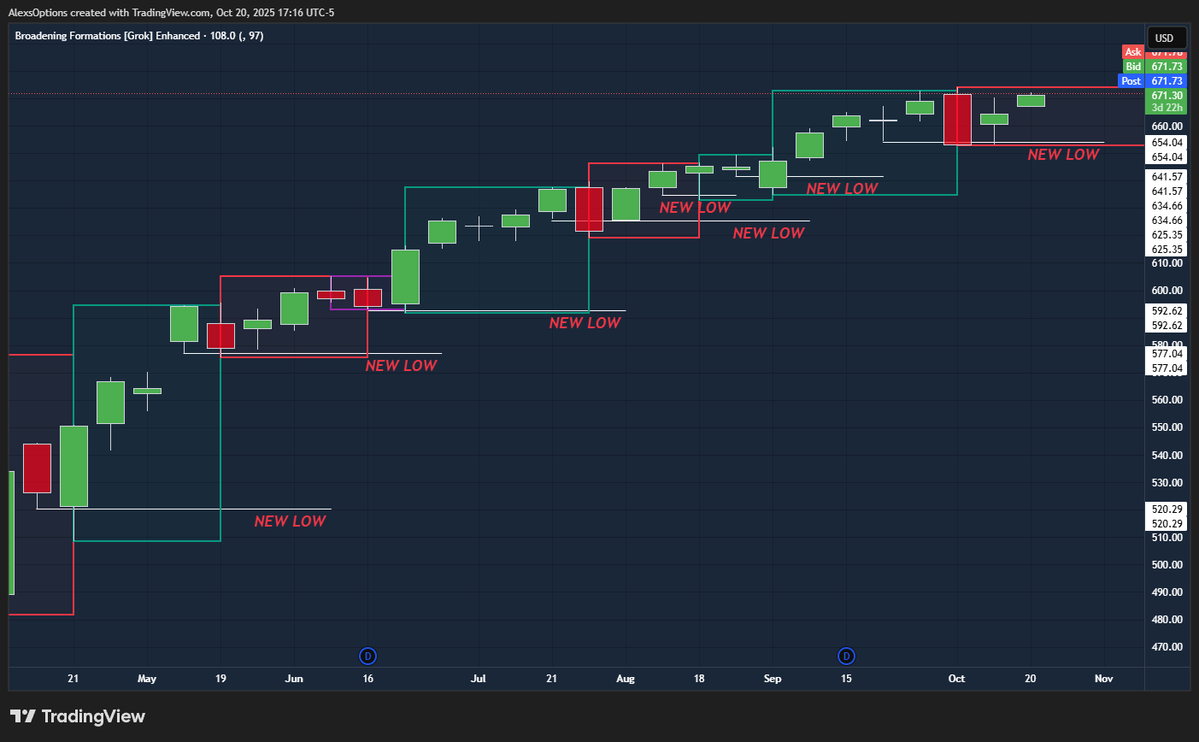
I wanted to touch on how we draw BF's based on the ideas of swing highs. I'll add that when I have some time if you guys like the thread.
Long story short with the BF's
Until there is a new swing high formed it is 'expando' of the range.
Once the swing high forms we re-draw
Long story short with the BF's
Until there is a new swing high formed it is 'expando' of the range.
Once the swing high forms we re-draw
• • •
Missing some Tweet in this thread? You can try to
force a refresh