Is El Niño already here, just not yet fully at the surface? 

Relatively cold water is rapidly being replaced by warmer water across the Equatorial Pacific.
The anomalies (bottom) show that the blue colors (La Niña) have rapidly disappeared across the tropics in the past three months.
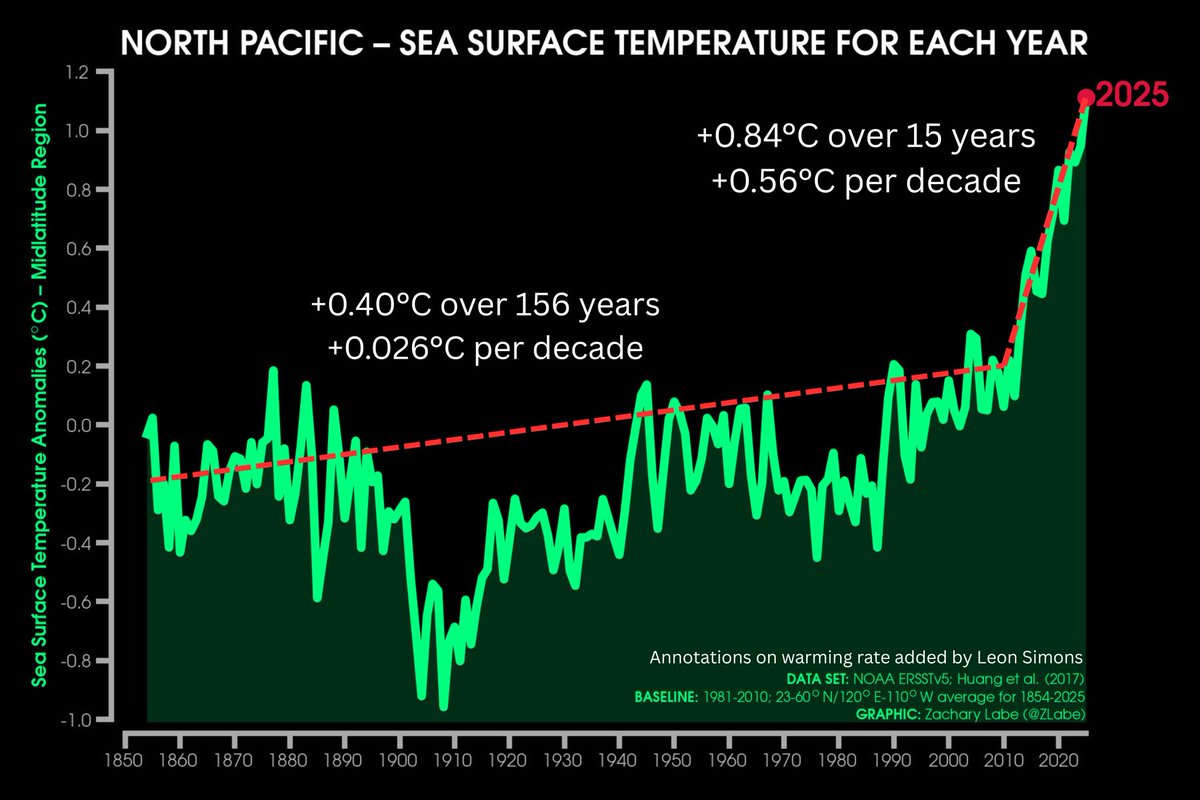
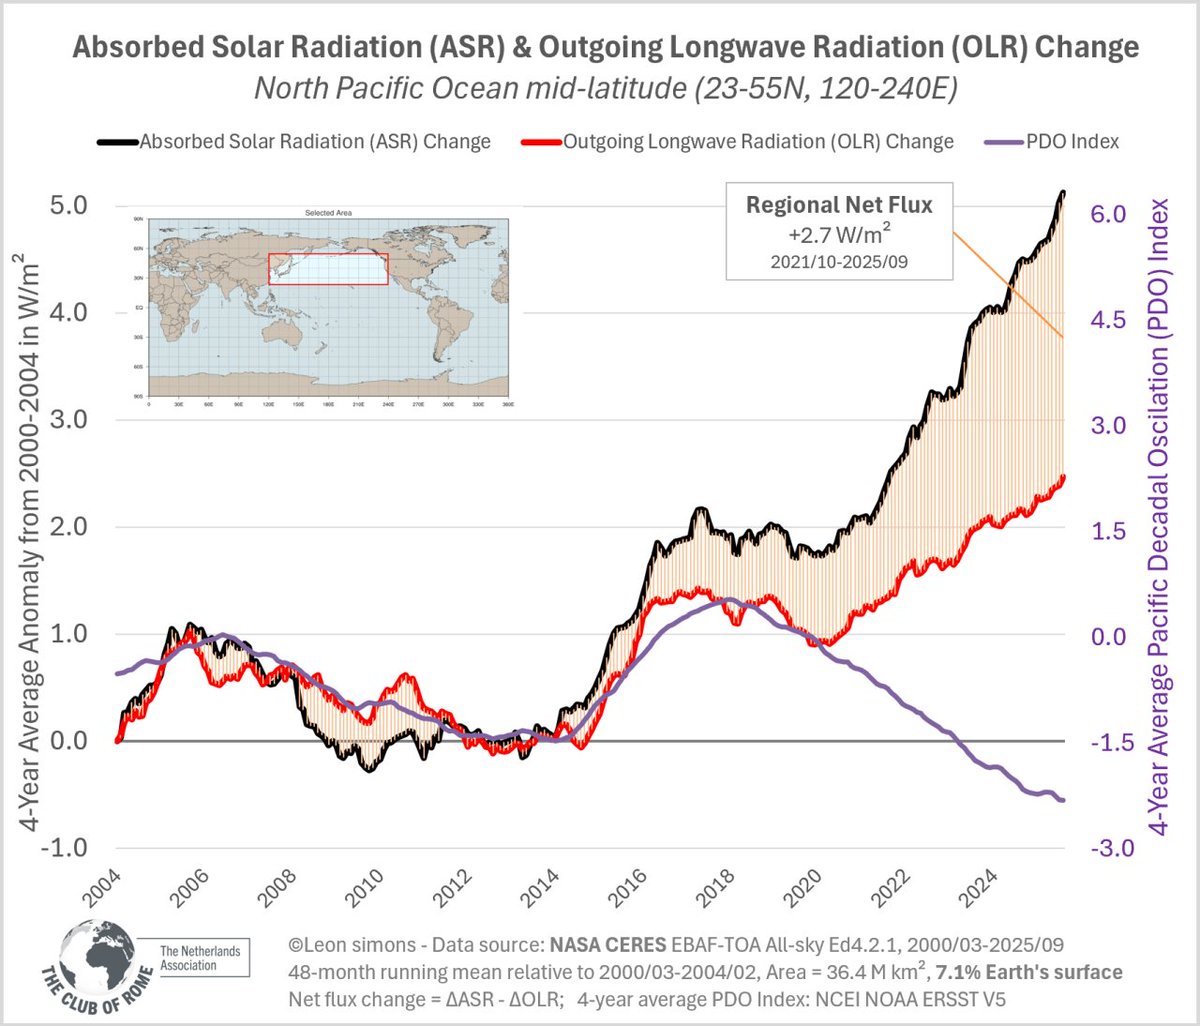
Also note how both the North Pacific and North Atlantic Oceans stay warmer than normal.
Also note how both the North Pacific and North Atlantic Oceans stay warmer than normal.
As they have the past years, especially since IMO2020 has come into effect:

These newest El Niño forcasts are eerily pointing towards a Super El Niño on the horizon.
50/50?
🪙
🫴
50/50?
🪙
🫴


• • •
Missing some Tweet in this thread? You can try to
force a refresh