Learning How to Analyze the Indexes in 3D Will Greatly Improved Your Accuracy And Bias Within the Market. TRUST ME.
Warning: ⚠️This thread is Pretty Advanced even for Veteran ICT Traders
Anyways, Here’s How👇💎#ICT
Warning: ⚠️This thread is Pretty Advanced even for Veteran ICT Traders
Anyways, Here’s How👇💎#ICT
Analyzing indexes in 3D is not something that came to me for a while. It’s better if you have a few different monitors to do this, but 1 is fine as long as you can scroll through quick enough.
You must be quick, and you must have a decent memory in order for this to work.
You must be quick, and you must have a decent memory in order for this to work.
Analyzing in 3D requires ES, NQ, and YM. If you want to go a step further, use DXY or the US10, 20, or 30 year bond.
I personally don’t feel as these are required. I have done very good analysis without the use of DXY. Only use DXY if you really aren’t sure about ES/NQ.
I personally don’t feel as these are required. I have done very good analysis without the use of DXY. Only use DXY if you really aren’t sure about ES/NQ.
Keep in mind I only trade ES, and NQ on my personal account.
Pros + Cons to trading NQ: Can whip around much faster than ES for more volatility, but stop losses might get hit easier
Pros + Cons to ES: Bit slower than NQ but moves a lot heavier making for a bit better risk
Pros + Cons to trading NQ: Can whip around much faster than ES for more volatility, but stop losses might get hit easier
Pros + Cons to ES: Bit slower than NQ but moves a lot heavier making for a bit better risk
The first thing you HAVE to look for is to see if all 3 indexes are correlated. What I mean by this is check to see if all three are in the same overall trend… Like this:
This is not the advanced part yet btw.
This is not the advanced part yet btw.
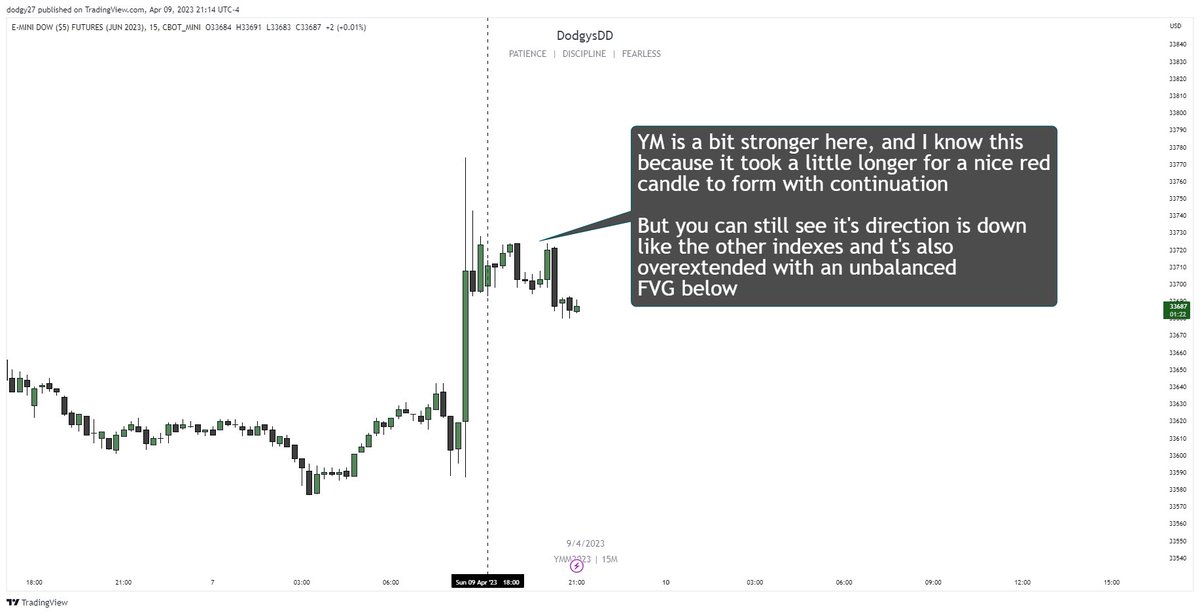

In this, I notice all three pumped off open but NQ and ES died quicker than YM. It took a bit for YM, but eventually all three saw downside with bearish order flow. This is good and tells me conditions are high probability and good to trade.
In this example, what do you notice? ES is consolidating, while NQ is dumping, and the DOW (YM) is pumping.
If you notice all three or even two doing the opposite, this means the index are uncorrelated, so stay out until they make a decision.
If you notice all three or even two doing the opposite, this means the index are uncorrelated, so stay out until they make a decision.


How do you know when they are correlated? This is where a deep understanding of ICT comes in to play.
The easy answer is “see if they are all going the same direction”
but this is NOT A GREAT TIP because you probably missed the play by then.
This is where it gets advanced.
The easy answer is “see if they are all going the same direction”
but this is NOT A GREAT TIP because you probably missed the play by then.
This is where it gets advanced.
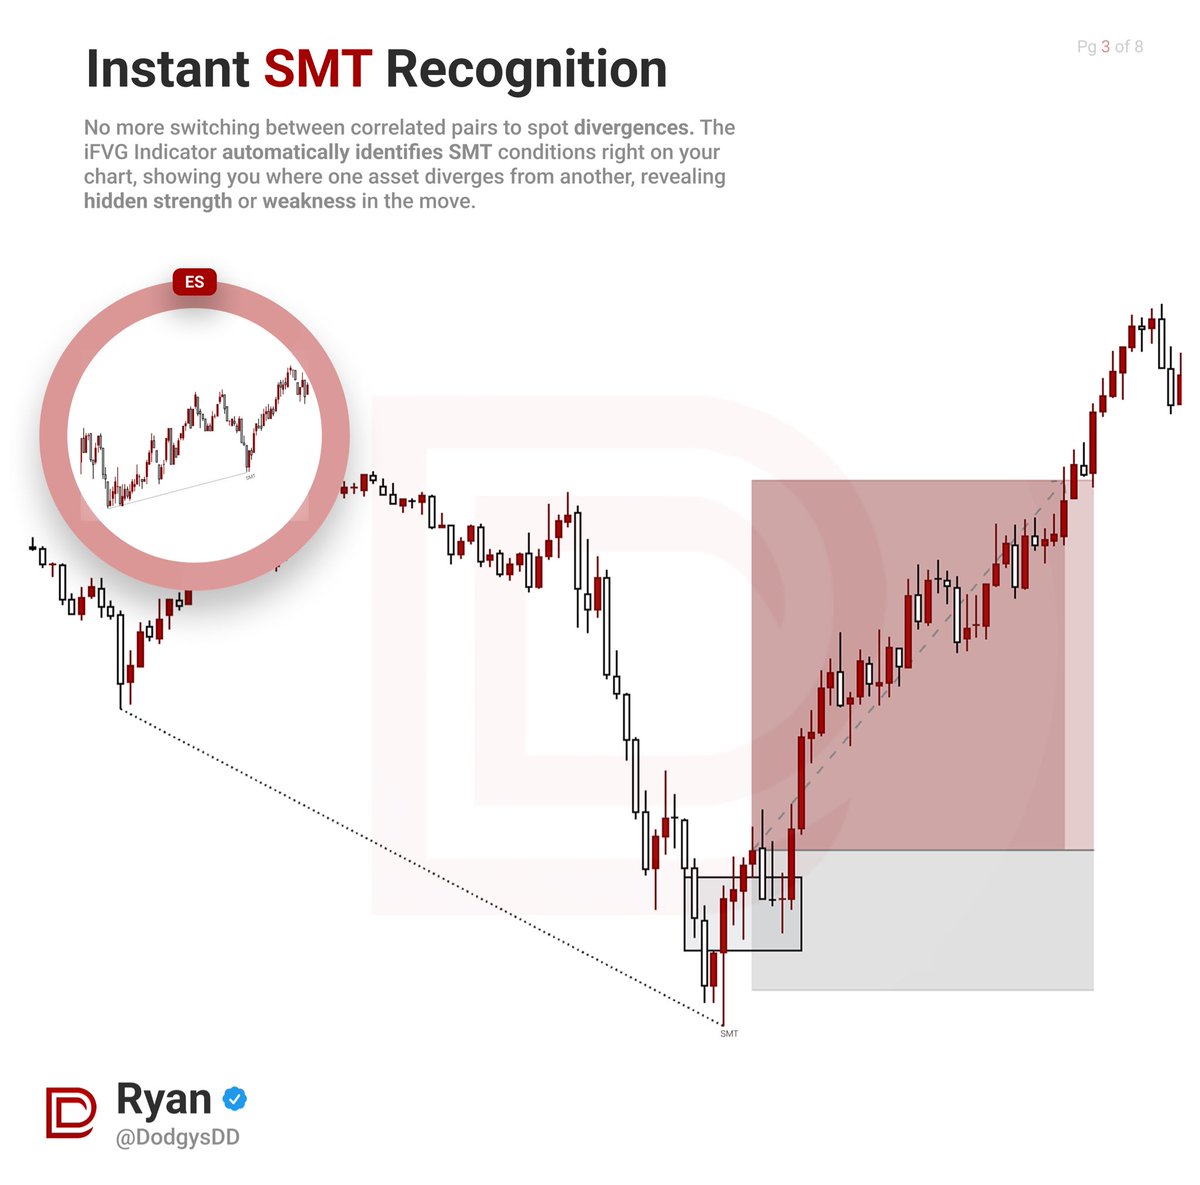
Here’s an example of what I may look for. In this example, all three indexes purged some sort of sellside liquidity. So on all three indexes I know stops were ran.
However, on YM, you can see the low created at 9:30 was not purged while on NQ and ES it was.
However, on YM, you can see the low created at 9:30 was not purged while on NQ and ES it was.


You must understand that YM STILL previously ran higher time frame stops, and even the 9:30 stops were ran, but NOW, there is a short term SMT after stops were ran on YM, so I still consider all three purged, with an additional SMT bullish confluence.
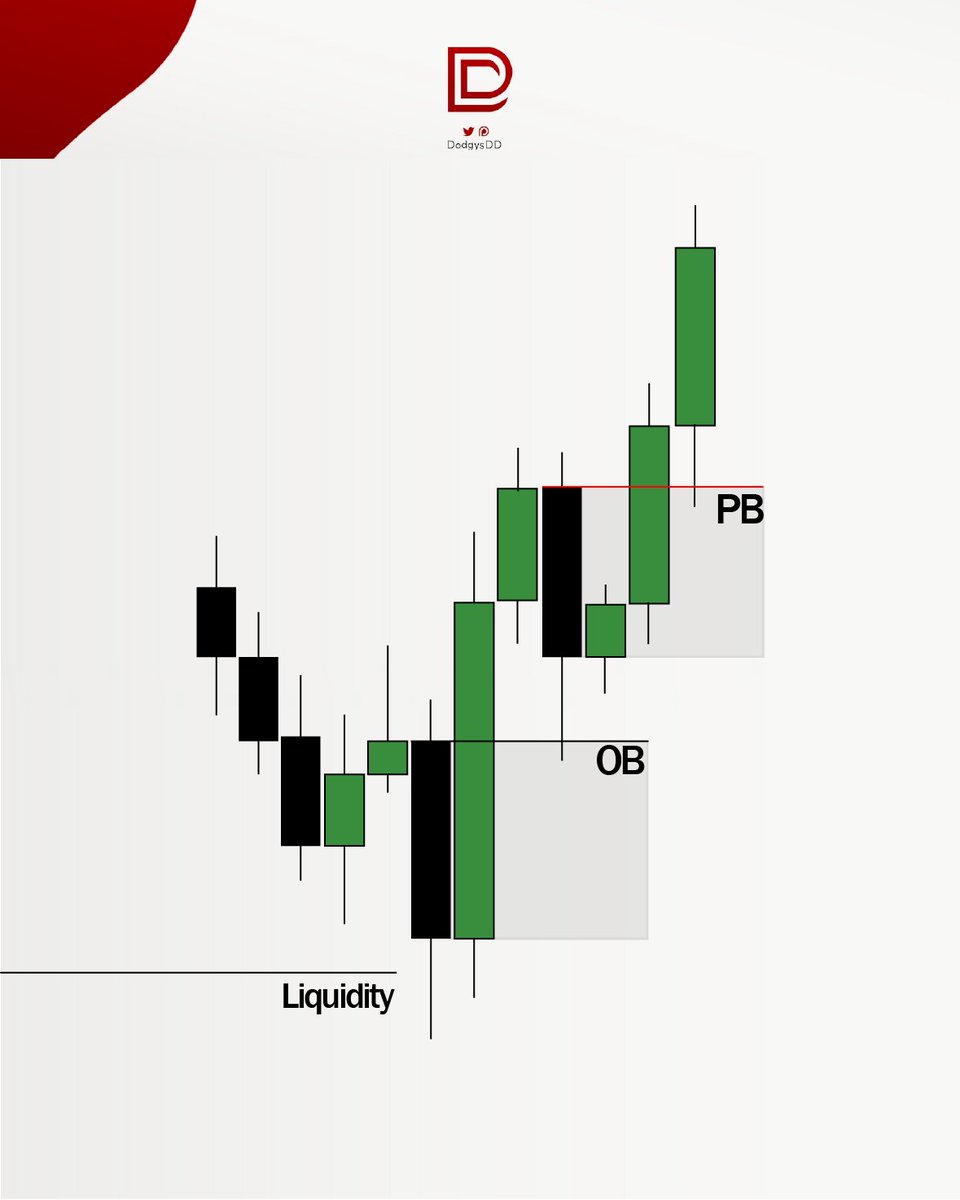
So take a look at these again. When looking at YM in this example, if you remember, I say whenever you see nice momentum through a FVG, the draw 90% of time should be the next high/low after the FVG. So on YM, see how we run through the bearish FVG before we do on ES and NQ?

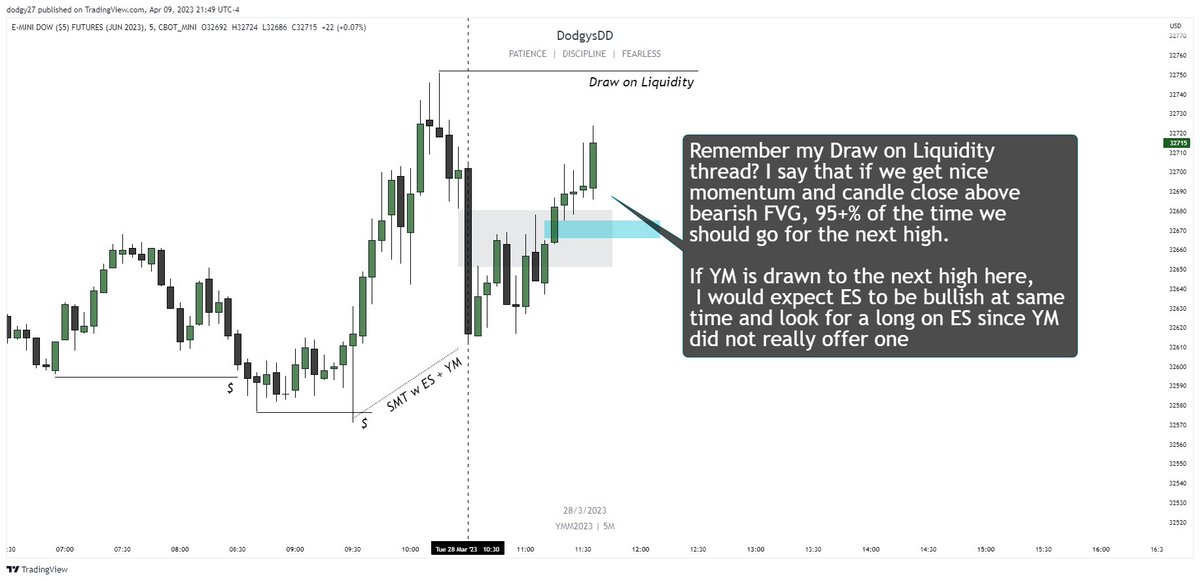
And do you see how this indicates the DOL SHOULD be the next high on YM? Well if I know this, that means YM should go higher which should push ES up. Well ES is in a bearish FVG, so I’m basically saying I’m expecting ES to break above the FVG which means it’s ok to look for longs
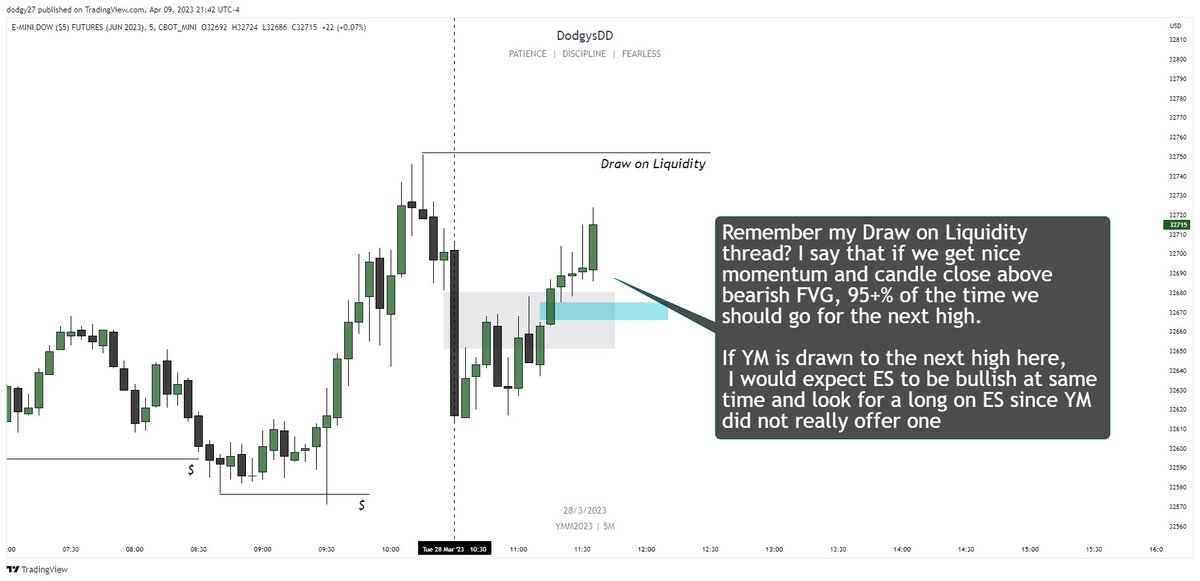

And if we tie back to my DOL thread, if ES pushes through the FVG with momentum, well than that means it’s draw should be the next high as well, re-pushing YM and NQ back higher.
So you can see , here’s the long on ES and in the end YM was the early indication of the ES long.
So you can see , here’s the long on ES and in the end YM was the early indication of the ES long.

So what I am trying to say is this:
Even though there was a bearish FVG on ES which might scare some people into not taking the long, it was still a good long because YM was indicating a higher draw as soon as ES and NQ entered the FVG. That’s when you look for ES/NQ to form FVG
Even though there was a bearish FVG on ES which might scare some people into not taking the long, it was still a good long because YM was indicating a higher draw as soon as ES and NQ entered the FVG. That’s when you look for ES/NQ to form FVG

Also, this is where you have to be smart in knowing when it’s not a good long on ES. If YM DID hit buyside already in this scenario and NQ JUST entered the bearish FVGs, then I would expect an SMT and I would expect ES and NQ to reject. But because YM did not hit it, that
indicates the bearish FVG in this scenario should’ve been ran through with YM expecting higher prices since it ran through it’s own bearish FVG while having an SMT and the other three indexes taking out sellside. This allowed it to be okay in taking the bullish FVG on ES.
In this next example, which I did call live, I show how you can kind of guess an SMT in live time using all three indexes.
All three indexes here are stopped at the same time, but what do I notice?
All three indexes here are stopped at the same time, but what do I notice?


I notice that while stopped, NQ has momentum back above the bearish fvg, which if you read my DOL thread you would know I normally target the next high in that sense, so if I think NQ draw is the high but I still see ES weak inside the bearish FVG, THAT’S when I expect SMT
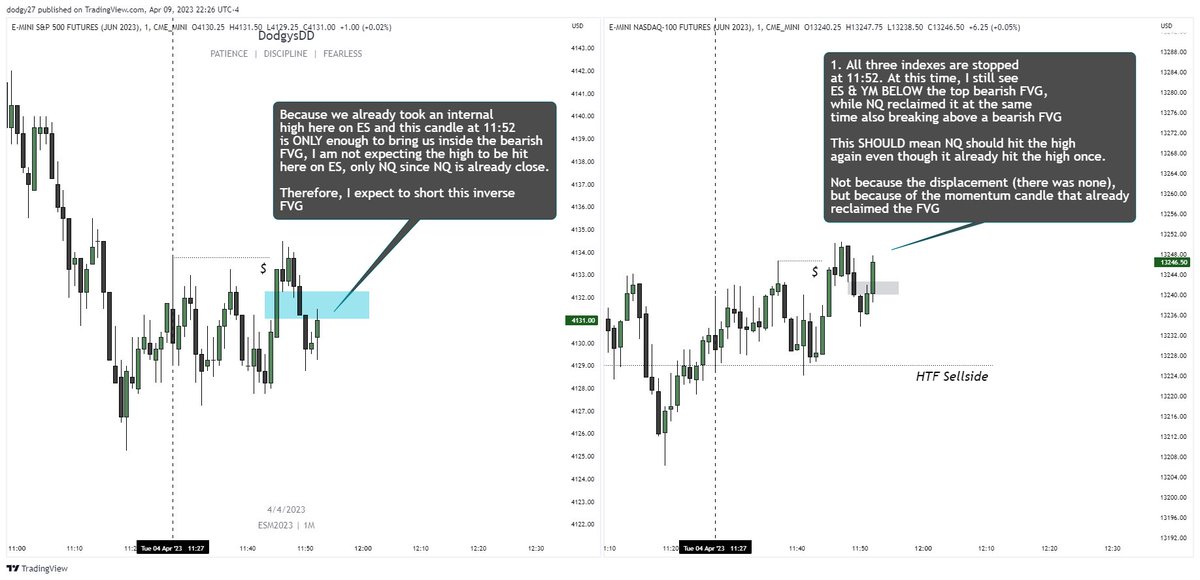

Also if you look carefully, we purged internal buyside on all 3 indexes, so on NQ, you SHOULD NOT expect another purge UNLESS it’s a turtle soup entry. When looking for purged of liquidity, you should not see them twice, or you’re probably wrong.


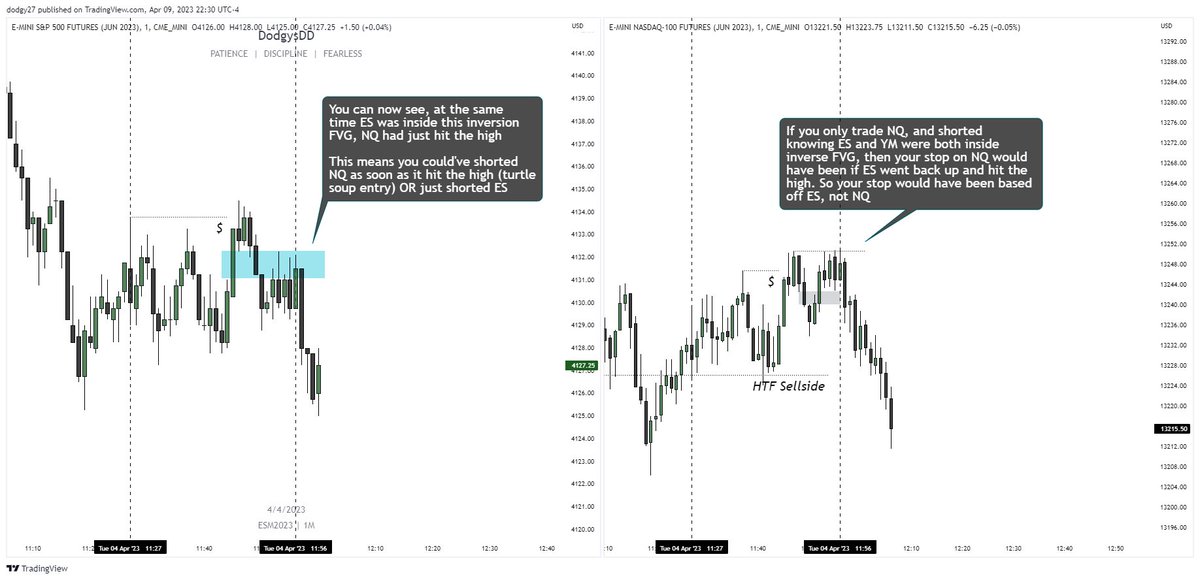
So now you can see what happened, we purged NQ Again, only to drop because the bias on ES was still bearish.
In this situation if I shorted NQ, my stop for NQ would’ve been based off ES, if ES broke above the bearish FVG with momentum I would’ve gotten out
In this situation if I shorted NQ, my stop for NQ would’ve been based off ES, if ES broke above the bearish FVG with momentum I would’ve gotten out


If I took ES, in this situation, my stop would’ve been above the previous high that NQ already hit. Because if it’s an SMT, ES should have not gone back to rehit the same high
That’s it for now, since making this thread I found a lot more examples this week I will probably go over later in the future, but remember, this did not come easy to me.
This is top tier analysis that will take practices, and I am still wrong about stuff sometimes.
This is top tier analysis that will take practices, and I am still wrong about stuff sometimes.
Here’s my discord if anyone has any questions discord.gg/RTawbjy2
• • •
Missing some Tweet in this thread? You can try to
force a refresh