The Kobeissi Letter Profile picture
Apr 16, 2023 7 tweets 3 min read Read on X
US national debt just hit a record $31.5 trillion, up over $8 trillion since 2020.

Total federal debt per household is now $240,000.

We now have a higher Debt/GDP ratio than post-World War 2, at 120%.

Here are some important facts about US national debt.

(a thread)

1/7
US national debt is now over 120% of GDP, which was $26.1 trillion in the fourth quarter of 2022.

In 2020, the Debt/GDP ratio hit a record 135% as the government passed over $4 trillion in stimulus.

By comparison, Debt/GDP after WW2 hit 114%.

The US has a TON of debt.

2/7 Image
21.8% of the public debt, or $6.9 trillion, is owned by the federal government itself.

This includes Medicare, specialized funds and retirement programs.

9.2% of US debt belongs to the Social Security program.

A program that may run out of money holds ~10% of our debt.

3/7 Image
Today, the Federal Reserve System is the largest holder of US debt.

After their massive balance sheet expansion during the pandemic, the Fed now owns ~20% of US debt.

At its peak in April 2022, the Fed held more than $6.25 trillion in US debt.

This was a historic move.

4/7 Image
Meanwhile, servicing US debt is one of the government's biggest expenses.

Net interest payments on the debt are estimated to total $396 billion this fiscal year, or 6.8% of all federal outlays.

Interest expense since 2010 has totaled over $3 trillion.

5/7 Image
Despite record high interest, rates on US debt are still at historic lows.

While this seems like good news, rates are rising as the Fed attempts to cool inflation.

Currently, rates on US debt are at ~2%, while in the 1990s, it was ~9%.

Interest expense is rising quickly.

6/7 Image
The US deficit is on track to hit $3 trillion by 2033 while Debt/GDP will hit 200% by 2046.

According to the US Treasury, “the rise in Debt/GDP indicates current fiscal policy is unsustainable.”

The debt crisis is here.

Follow us @KobeissiLetter for more as this develops.

7/7

• • •

Missing some Tweet in this thread? You can try to force a refresh
 

Keep Current with The Kobeissi Letter

The Kobeissi Letter Profile picture

Stay in touch and get notified when new unrolls are available from this author!

Read all threads

This Thread may be Removed Anytime!

PDF

Twitter may remove this content at anytime! Save it as PDF for later use!

Try unrolling a thread yourself!

how to unroll video
  1. Follow @ThreadReaderApp to mention us!

  2. From a Twitter thread mention us with a keyword "unroll"
@threadreaderapp unroll

Practice here first or read more on our help page!

More from @KobeissiLetter

Jan 2
Why is this not getting more attention?

US credit card serious delinquency rates for subprime borrowers just hit ~22%, the highest since 2010.

Meanwhile, delinquency rates on commercial office loans are now at 11%, ABOVE the 2012 peak.

We are in a debt crisis.

(a thread)
To start, here's a chart of US credit card serious delinquency rates for subprime borrowers.

Subprime credit card delinquencies have risen 7 percentage points in just ~15 months.

These borrowers reflect a WHOPPING ~23% of the consumer credit market, according to Fed data. Image
This comes as US credit card debt hit a record $1.17 TRILLION in Q3 2024, according to the NY Fed.

Some estimates put total credit card debt well above $1.3 trillion.

The average interest rate on this credit card debt is also setting at an all time high of 23.4%. Image
Read 11 tweets
Jan 1
This is absolutely insane:

Heading into 2025, there are now 100 TIMES more assets in leveraged long funds than leveraged short funds.

Over the last 8 weeks, this ratio has DOUBLED, exceeding the record high set in December 2021.

Is the bull trade too crowded?

(a thread)
Here's a chart showing the ratio of assets in leveraged long to short funds.

Assets in US leveraged ETF reached a record ~$120 BILLION.

December 2021 was the last time the bull trade was this crowded.

So, what happened the last time the bull trade was this crowded? Image
For some background:

Bullish bets have risen as the S&P 500 posted its first back-to-back annual gain of 20%+ since 1998.

Since the beginning of 2023, the S&P 500 has risen 53%.

Since 2020, the S&P 500 is up over 80% in what has been a historic run.

Bulls have taken control. Image
Read 11 tweets
Dec 31, 2024
2024 was BRUTAL for homebuyers:

For the first time since 2005, US new home prices became CHEAPER than existing home prices.

In fact, only ~4 million existing homes were sold in 2024, the lowest since 1995.

Here are Apollo's shocking housing market facts into 2025.

(a thread)
1. US homes are getting smaller: The size of new homes being built has declined by 12% since 2016

The median new home is now ~2,175 square feet after nearing as high as 2,500 square feet in 2016.

After years of elevated inflation, people can't afford bigger homes anymore. Image
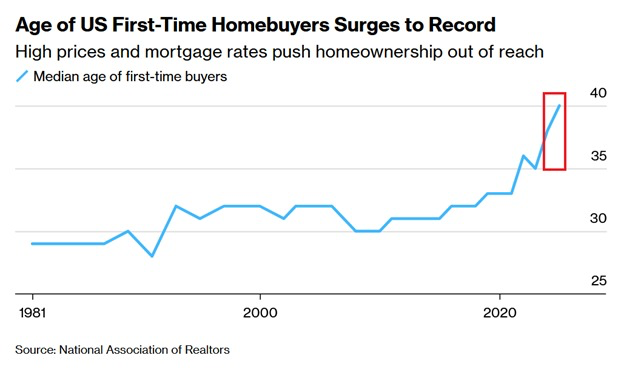
2. The median age of all homebuyers is now 49 years old, up from 31 in 1981

Buying a home is now considered a luxury for most millennials.

Millions of young Americans can now only (barely) afford to rent a home.

Rent prices broke above a record $2,000/mo in 2024. Image
Read 12 tweets
Dec 30, 2024
Something doesn't add up here:

MicroStrategy, $MSTR, has been known as the most popular "levered" #Bitcoin play of the year.

Meanwhile, over the last month Bitcoin has gained +2% while $MSTR is currently down nearly -50%.

What is happening? Let us explain.

(a thread)
Here's a comparison of $MSTR vs #Bitcoin since November 20th.

Bitcoin has traded almost completely flat on a net basis, even after rising as much as +16%.

Meanwhile, $MSTR is down ~36% and continues to widen the gap between the two assets.

Why is this happening? Image
If $MSTR is really just a levered #Bitcoin play, why is there such a large divergence.

Here's the S&P 500 ETF, $SPY, compared to a triple levered S&P 500 ETF, $SPXL.

Since November 1st, $SPY is up ~3.5% while $SPXL is up ~9.8%.

This makes sense as it is TRIPLE levered. Image
Read 12 tweets
Dec 29, 2024
WOW.

US equity funds saw a -$35.3 BILLION net outflow last week, the largest weekly outflow since December 2022.

This is a sharp contrast to the ~$14 billion of weekly net INFLOWS seen since Fed interest rate cuts began.

What does this mean as we head into 2025?

(a thread)
Here's a chart showing weekly flows for US equity funds in 2024.

There have only been a handful of weeks with net outflows as the S&P 500 hit 57 all-time highs in 2024.

2 weeks ago, US equity funds saw a record $62.5 billion of net inflows.

Last week marked a clear shift. Image
On Friday, a small early-morning decline turned into a deep red day for stocks.

The Nasdaq dropped nearly 1.5% and the S&P 500 erased its "Santa Claus" rally, now down since December 24th.

It's clear that profit taking has commenced as we head into 2024. Image
Read 13 tweets
Dec 28, 2024
China's economy is rapidly slowing:

While treasury yields in the United States hit new 7-month highs, China's 10-year yield just hit a new RECORD low.

In fact, China's 10-year government bond yield has now HALVED since January 2024.

What is happening in China?

(a thread)
China’s $11 trillion government bond market has moved into uncharted territory.

As their government rolls out widespread stimulus, yields are hitting record lows.

The gap between yields in Japan and China are now at a record low of just ~70 basis points.

China is in trouble. Image
Meanwhile, yields in the US are skyrocketing with the 10-year now nearing 5.00%.

The spread between China and the United States' 10-year yield just hit a record 294 basis points.

Never in history has the spread been even remotely this large, with the average at ~100 bps. Image
Read 12 tweets

Did Thread Reader help you today?

Support us! We are indie developers!


This site is made by just two indie developers on a laptop doing marketing, support and development! Read more about the story.

Become a Premium Member ($3/month or $30/year) and get exclusive features!

Become Premium

Don't want to be a Premium member but still want to support us?

Make a small donation by buying us coffee ($5) or help with server cost ($10)

Donate via Paypal

Or Donate anonymously using crypto!

Ethereum

0xfe58350B80634f60Fa6Dc149a72b4DFbc17D341E copy

Bitcoin

3ATGMxNzCUFzxpMCHL5sWSt4DVtS8UqXpi copy

Thank you for your support!

Follow Us!

:(