PyQuant News 🐍 Profile picture
Apr 17 6 tweets 2 min read Twitter logo Read on Twitter
Trading the wrong strategy is a recipe for losing money.

Pick the right strategy for the market.

Use the Hurst exponent to help.

Here’s how with Python:
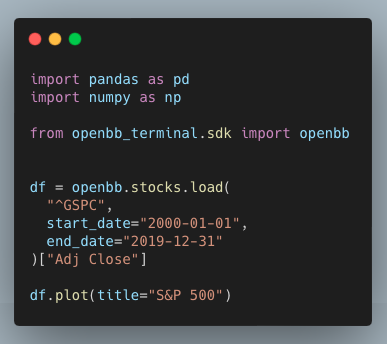
Get data with the OpenBB SDK.

I use 20 years for S&P 500 prices. Image
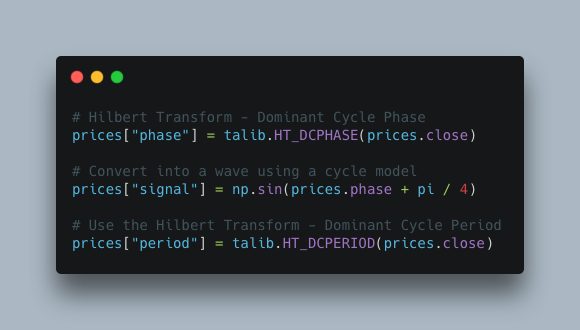
Calculate the Hurst exponent.

If it’s confusing, check out the recent newsletter for details (link at the bottom). Image
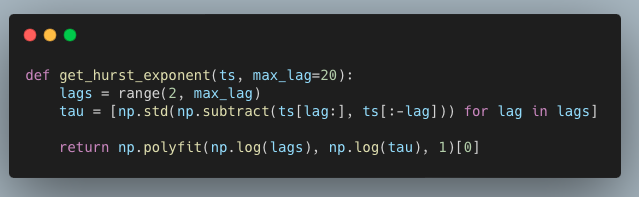
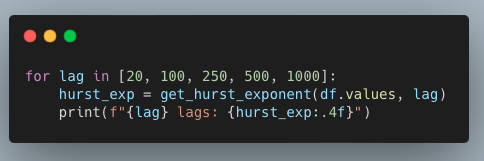
The Hurst exponent is sensative to the lag.

So iterate through a few. Image
Use the Hurst exponent to help you pick the right trading strategy.

I break down all the details in a recent newsletter issue:

• Get data
• Calculate Hurst
• Identify the market

Get it here:

pyquantnews.com/how-to-pick-th…
The FREE 7-day masterclass that will get you up and running with Python for quant finance.

Here's what you get:

• Working code to trade with Python
• Frameworks to get you started TODAY
• Trading strategy formation framework

7 days. Big results.

pythonforquantfinancemasterclass.com

• • •

Missing some Tweet in this thread? You can try to force a refresh
 

Keep Current with PyQuant News 🐍

PyQuant News 🐍 Profile picture

Stay in touch and get notified when new unrolls are available from this author!

Read all threads

This Thread may be Removed Anytime!

PDF

Twitter may remove this content at anytime! Save it as PDF for later use!

Try unrolling a thread yourself!

how to unroll video
  1. Follow @ThreadReaderApp to mention us!

  2. From a Twitter thread mention us with a keyword "unroll"
@threadreaderapp unroll

Practice here first or read more on our help page!

More from @pyquantnews

Apr 19
My master's degree completely failed to teach me Python for quant finance (they taught me MATLAB).

And Octave (WTF?)

So I watched 200 YouTube videos.

And the truth is, 96% of them were a complete waste of time.

But these 8 taught me more than all my PhD professors combined:
Algorithmic Trading Using Python (4.5 hours)

Learn how to perform algorithmic trading using Python in this complete course. Algorithmic trading means using computers to make investment decisions.

Quantitative Stock Price Analysis with Python (25 minutes)

We look at some quantitative analytical methods of stock price changes using Python and pandas.

Read 12 tweets
Apr 17
The undisputed champion of the markets:

Renaissance Technologies.

They use top-secret data processing techniques to return 66% every year.

You can't be Jim Simons, but you can use signal processing like him.

Here's how with Python:
Use OpenBB to download the EUR/USD price and get the returns. Image
Identify the cycle phases. Image
Read 9 tweets
Apr 13
The BEST algo trading simulator:

Zipline.

Quantopian had $100,000,000 in algorithmic strategies using Zipline.

300,000 people used Zipline on their platform.

So I spent 100 hours studying the code so I could use it too.

The step-by-step guide to getting started in 5 minutes:
Zipline was maintained by Quantopian before it was acquired in 2020.

Some of the features:

• Easy to use so you can focus on algo development
• Includes life-like slippage and commission models
• Dozens of common performance metrics built-in

Ready to dive in?
Start with the imports.

You’ll use pandas_datareader for index data, matplotlib for charting, and PyFolio for performance analysis. Image
Read 14 tweets
Apr 12
Some market data costs $1,400 per month.

The oil that makes the world's financial markets operate.

Unaffordable for 99% of us.

A profit center for countless Wall Street firms.

Fight back.

Here are the 12 Python libraries that give it to you free:
yfinance

Data for stocks (historic, intraday, fundamental), FX, crypto, and options. Uses Yahoo Finance so any data available through Yahoo is available through yfinance.

github.com/ranaroussi/yfi…
pandas-datareader

pandas-datareader used to be part of the pandas project. Now an independent project. Includes data for stocks, FX, economic indicators, Fama-French factors, and many others.

pandas-datareader.readthedocs.io/en/latest/
Read 16 tweets
Apr 10
The Treynor ratio measures the reward-to-volatility ratio.

It helps traders understand how much reward they get for each unit of risk.

You don’t need to be a high-flying trader to use it.

You just need a few lines of Python.

Here’s how it works:
All you need is data.

Import the OpenBB SDK to get it.

This code pulls 8 years of stock price history, extracts the price data, and computes the daily returns. Image
Next, compute beta.

It’s the covariance between the returns of the benchmark and the asset divided by the variance of the benchmark.

Using pandas makes it easy to compute it. Image
Read 7 tweets
Apr 6
I spent a good portion of my $90,000 master's degree learning 1 thing:

Simulating stock prices.

The good news?

You don't need a master's degree to build your own stock price simulator in Python.

I'm going to show you how step-by-step:
By reading this thread, you'll be able to build your own stock price simulator in Python.

Here's what you'll learn:

1. About Geometric Brownian Motion
2. Import libraries and set up
3. Build the functions
4. Visualize results

Ready?
A primer:

GBM is a continuous-time stochastic process where the log of the random variable follows the Wiener process with drift.

What?

It’s a data series that trends up or down through time with a defined level of volatility.

And it’s perfect for simulating stock prices.
Read 15 tweets

Did Thread Reader help you today?

Support us! We are indie developers!


This site is made by just two indie developers on a laptop doing marketing, support and development! Read more about the story.

Become a Premium Member ($3/month or $30/year) and get exclusive features!

Become Premium

Don't want to be a Premium member but still want to support us?

Make a small donation by buying us coffee ($5) or help with server cost ($10)

Donate via Paypal

Or Donate anonymously using crypto!

Ethereum

0xfe58350B80634f60Fa6Dc149a72b4DFbc17D341E copy

Bitcoin

3ATGMxNzCUFzxpMCHL5sWSt4DVtS8UqXpi copy

Thank you for your support!

Follow Us on Twitter!

:(