
Here are the 7 most important charts to understand the United States' fiscal position...
...and why we are heading towards a debt-spiral black hole.
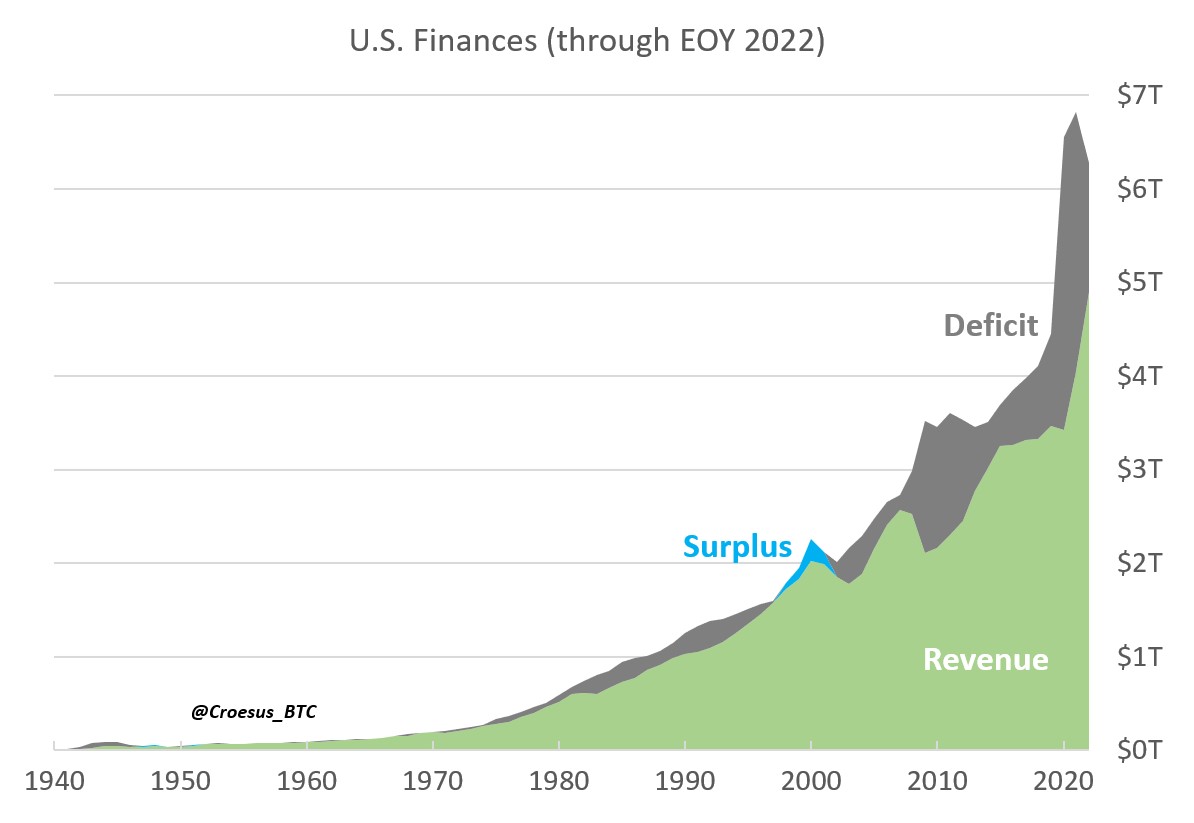
#1 - Here is the annual budget Surplus or Deficit through 2022.
...and why we are heading towards a debt-spiral black hole.
#1 - Here is the annual budget Surplus or Deficit through 2022.

#2 - The problem with deficits is that they add up. Each annual deficit adds to the total National Debt.
This debt hole grows bigger because of annual interest expense on all this debt.
Not a problem when interest rates are ~0%. Big problem when they're 5% per year (now).
This debt hole grows bigger because of annual interest expense on all this debt.
Not a problem when interest rates are ~0%. Big problem when they're 5% per year (now).

#3 - We could reverse this trend if the US Gov could just spend less than it brings in via tax revenue.
But this hasn't happened in 22 years.
There is no political will to balance the budget. That's why these deficits are the norm. Here's 2022:
But this hasn't happened in 22 years.
There is no political will to balance the budget. That's why these deficits are the norm. Here's 2022:

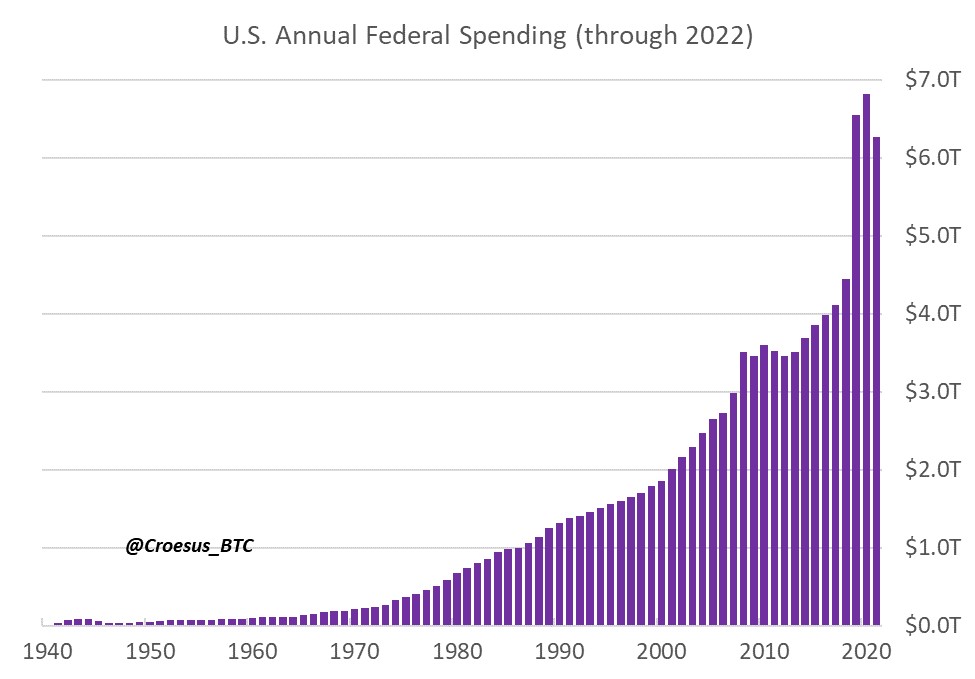
#4 - To rein in these deficits, the US Gov could cut spending.
Yet, every politician is incentivized to "bring home the bacon" for their constituents and donors.
At no point has the US managed to implement meaningful austerity. Spending only goes up-and-to-the-right.
Yet, every politician is incentivized to "bring home the bacon" for their constituents and donors.
At no point has the US managed to implement meaningful austerity. Spending only goes up-and-to-the-right.
#5 - The US Gov could raise taxes to solve the problem. This has happened (and will continue).
In 1913, income tax was introduced - it only applied to the richest 3% and rates were limited to between 1-6%. And now?
Problem is politicians spend faster than tax revenue increases
In 1913, income tax was introduced - it only applied to the richest 3% and rates were limited to between 1-6%. And now?
Problem is politicians spend faster than tax revenue increases
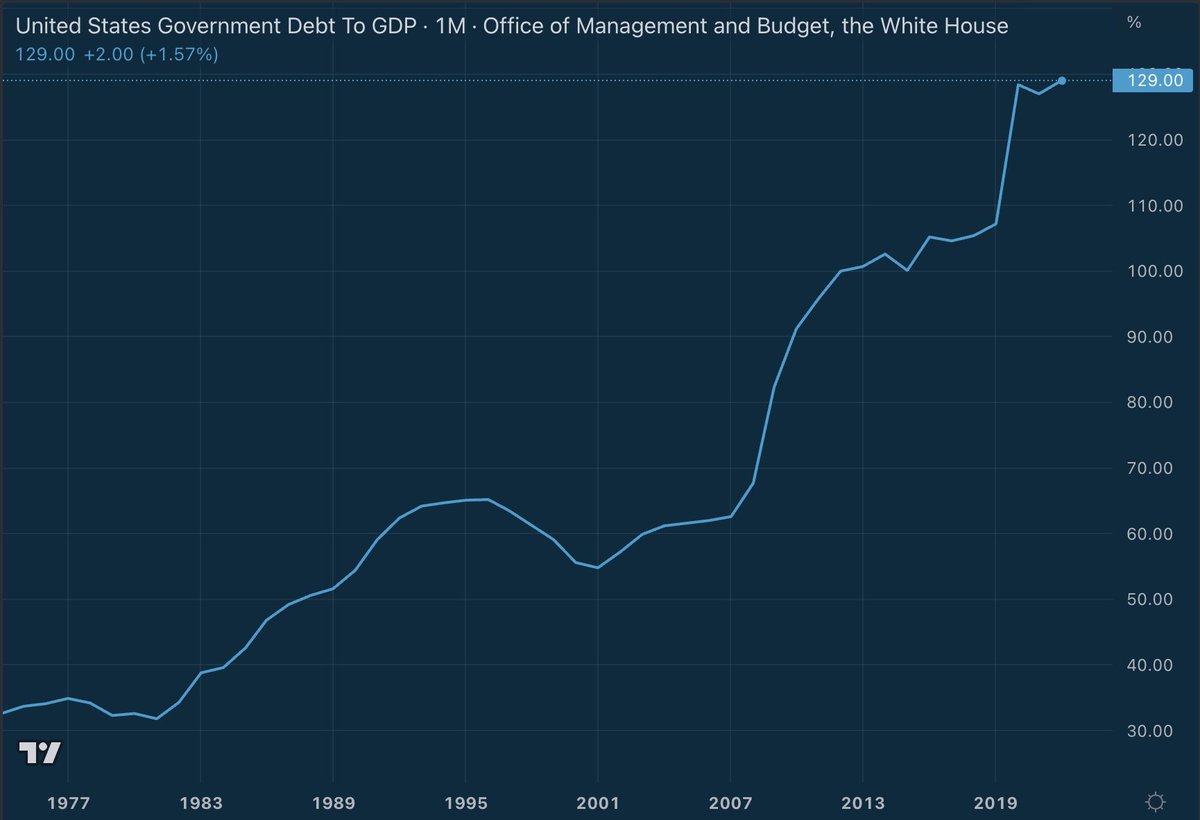
#6 - The danger of the growing National Debt is the debt-spiral black hole
The more debt we have, the larger the interest expense on our debt, which causes larger annual deficits
Since 1800, 51 out of 52 countries who reached 130% debt-to-GDP eventually defaulted
US now = 129%
The more debt we have, the larger the interest expense on our debt, which causes larger annual deficits
Since 1800, 51 out of 52 countries who reached 130% debt-to-GDP eventually defaulted
US now = 129%
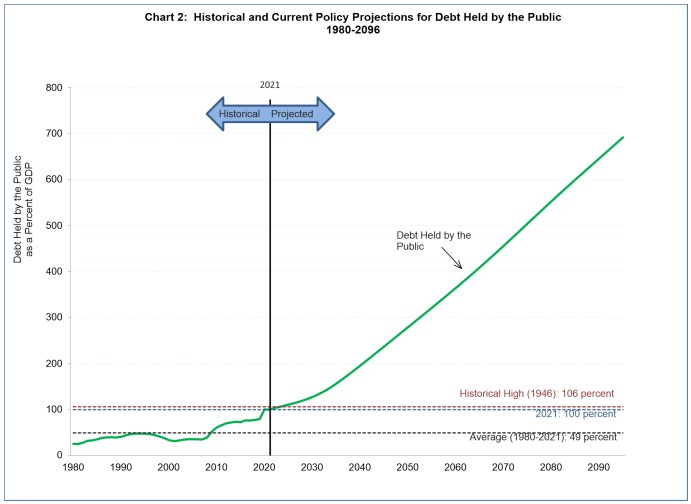
#7 - What's more, this danger doesn't seem to be understood by US Gov officials.
Here's an actual projection of debt-to-GDP into the future that the US Treasury Department released. h/t @LynAldenContact
Here's an actual projection of debt-to-GDP into the future that the US Treasury Department released. h/t @LynAldenContact
But there is something that theoretically could still save the United States from the debt-spiral black hole.
Here's @LukeGromen discussing what it would take:
Here's @LukeGromen discussing what it would take:
Find out why the US will not be able to save itself from its National Debt.
And learn what you can do to save yourself... and actually thrive: jessemyers.substack.com/p/643-april-20…
And learn what you can do to save yourself... and actually thrive: jessemyers.substack.com/p/643-april-20…
Some folks who have loudly trumpeted this warning (and who might enjoy the charts in this thread):
@PrestonPysh @saylor @LynAldenContact @LukeGromen @FossGregfoss @LawrenceLepard @jameslavish @JeffBooth @CedYoungelman @samcallah @MartyBent @ODELL @BitcoinIsSaving @maxkeiser
@PrestonPysh @saylor @LynAldenContact @LukeGromen @FossGregfoss @LawrenceLepard @jameslavish @JeffBooth @CedYoungelman @samcallah @MartyBent @ODELL @BitcoinIsSaving @maxkeiser
If you're looking to Onramp to the #Bitcoin lifeboat the right way, get in touch with us:
(Note: for accredited investors and institutions only)onrampbitcoin.com
(Note: for accredited investors and institutions only)onrampbitcoin.com
• • •
Missing some Tweet in this thread? You can try to
force a refresh


