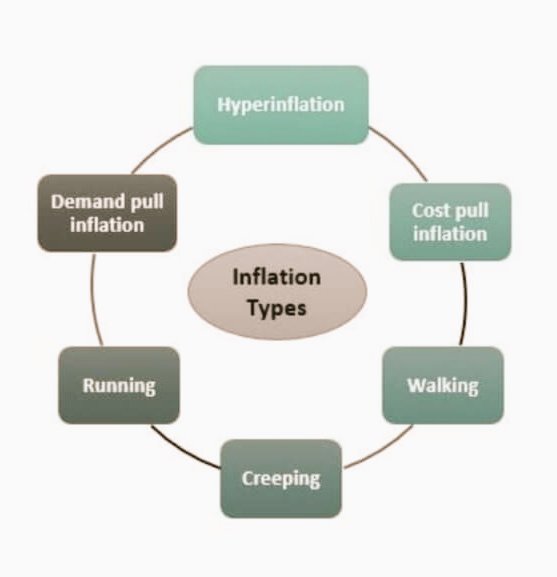
Twitter author Profile picture
Apr 21 7 tweets 2 min read Twitter logo Read on Twitter
Inflation Types
#1 – Demand Pull Inflation
#2 – Creeping Inflation
#3 – Cost-Pull Inflation
#4 – Walking Inflation
#5 – Galloping Inflation
#6 – Hyperinflation Image
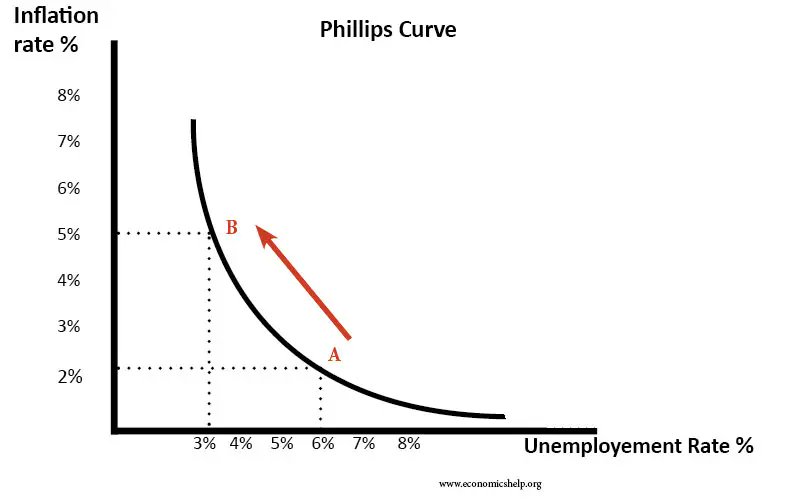
#1 Demand pull infation-If aggregate demand (AD) rises faster than productive capacity,then firms will respond by putting up prices,creating inflation.
See below 👇
A rise in demand causes a fall Unemployment (from 6% to 3%) but an increase in inflation from inflation of 2% to 5% Image
#2 –Creeping Inflation a condition where the inflation in a country increases slowly but continuously over a period of time and the effect of inflation is noticed after a long period of time.
Ex-if the inflation is at the rate of 3% it will take 33 years for the prices to double.
#3 – Cost-Pull Inflation
This situation appears when the cost of production forces firms to increase their prices. For example, the factors of production like labor, raw material, and technology are getting expensive.
4-Walking Inflation is faster than creeping inflation,but not as fast as galloping or hyperinflation. It is harmful to the economy because it heats up economic growth too quickly.People start to buy more than they need in order to avoid tomorrow's much higher prices.
#5-Galloping Inflation
When inflation rises to 10% or more, it can be very damaging to the economy. Money loses value so quickly that business and employee income can't keep up with costs and prices.The economy becomes unstable, and government leaders lose credibility.
#6 Hyperinflation- occurs when prices skyrocket by more than 50% per month. It is very rare.most examples of hyperinflation occur when governments print money to pay for wars. One of the most extreme examples is Hungary, where in 1945, prices doubled every 15 hours.
#UPSC2023

• • •

Missing some Tweet in this thread? You can try to force a refresh
 

Keep Current with Twitter author

Twitter author Profile picture

Stay in touch and get notified when new unrolls are available from this author!

Read all threads

This Thread may be Removed Anytime!

PDF

Twitter may remove this content at anytime! Save it as PDF for later use!

Try unrolling a thread yourself!

how to unroll video
  1. Follow @ThreadReaderApp to mention us!

  2. From a Twitter thread mention us with a keyword "unroll"
@threadreaderapp unroll

Practice here first or read more on our help page!

More from @

Apr 23
8 Disputed Island of the World.
#upsc
1-Falkland Islands Claims by United Kingdom and Argentina.
Location- south-west Atlantic Ocean Image
2-Chagos Islands
Claims by the United Kingdom and Mauritius.
Location- Indian Ocean Image
3-Kuril Islands
Claims by Japan and Russia Image
Read 8 tweets
Apr 22
ECONOMIC CYCLE
#1-RECESSION
#2-DEPRESSION
#3-SLOWDOWN
#4-MELTDOWN
1-RECESSION
Recession refers to a phase of the downturn in the economic cycle when there is a fall in the country’s GDP for some quarters.
‘A recession is a period of decline in total output, income, employment and trade, usually lasting six months to a year.’
#2 DEPRESSION
When recession, turns out to be more severe and continues for a long term.
A common rule of thumb for depression is a negative GDP of 10% of more, for more than 3 years.
Read 5 tweets
Apr 21
Some other inflation term-
#1 Structural inflation
#2 Disinflation
#3 Deflation
#4 Open inflation
#5 Repressed/supressed inflation
#6 Skewflation
#7 Stagflation
#8 Core Inflation
#9 Headline inflation

See below👇
#1 Structural Inflation- Developing and Low-Income Countries.
Example:In India,let’s assume that the farmer produces fruits and vegetables at 10000 per quintal.But the final consumer gets the same at 20000 per quintal.Huge disparity between what farmer receives and consumer pays
#2 Disinflation-Disinflation is a situation in which the rate of inflation falls over a period of time. Remember the difference; disinflation is when the inflation rate is falling from say 5% to 3%.
Read 9 tweets
Apr 21
List of Important Curves In Economics :
1-Lorenz Curve
2-Gini Coefficient
3-Kuznets Curve 
4-Laffer Curve
5-Philips Curve
See in detail👇
1-Lorenz Curve is a graphical distribution of wealth. It shows the proportion of income earned by any given percentage of the population.
It was developed by Max Lorenz in 1905.
The given figure shows that 20% of people earns only 5% of income. Image
2-Gini Coefficient

The Gini Coefficient, which is derived from the Lorenz Curve, can be used as an indicator of economic development in a country.
Its value varies anywhere from zero to 1, zero indicating perfect equality and one indicating the perfect inequality.
Read 6 tweets

Did Thread Reader help you today?

Support us! We are indie developers!


This site is made by just two indie developers on a laptop doing marketing, support and development! Read more about the story.

Become a Premium Member ($3/month or $30/year) and get exclusive features!

Become Premium

Don't want to be a Premium member but still want to support us?

Make a small donation by buying us coffee ($5) or help with server cost ($10)

Donate via Paypal

Or Donate anonymously using crypto!

Ethereum

0xfe58350B80634f60Fa6Dc149a72b4DFbc17D341E copy

Bitcoin

3ATGMxNzCUFzxpMCHL5sWSt4DVtS8UqXpi copy

Thank you for your support!

Follow Us on Twitter!

:(