Crémieux Profile picture
Apr 22 7 tweets 3 min read Twitter logo Read on Twitter
Have you ever wondered how pervasive p-hacking is?

I have a new Substack post that provides an answer to and I even figured out which field does the least of it.

Here are 26 fields ranked in terms of the percentages of their p-values that are dubious.

cremieux.substack.com/p/ranking-fiel… A chart showing that fields...
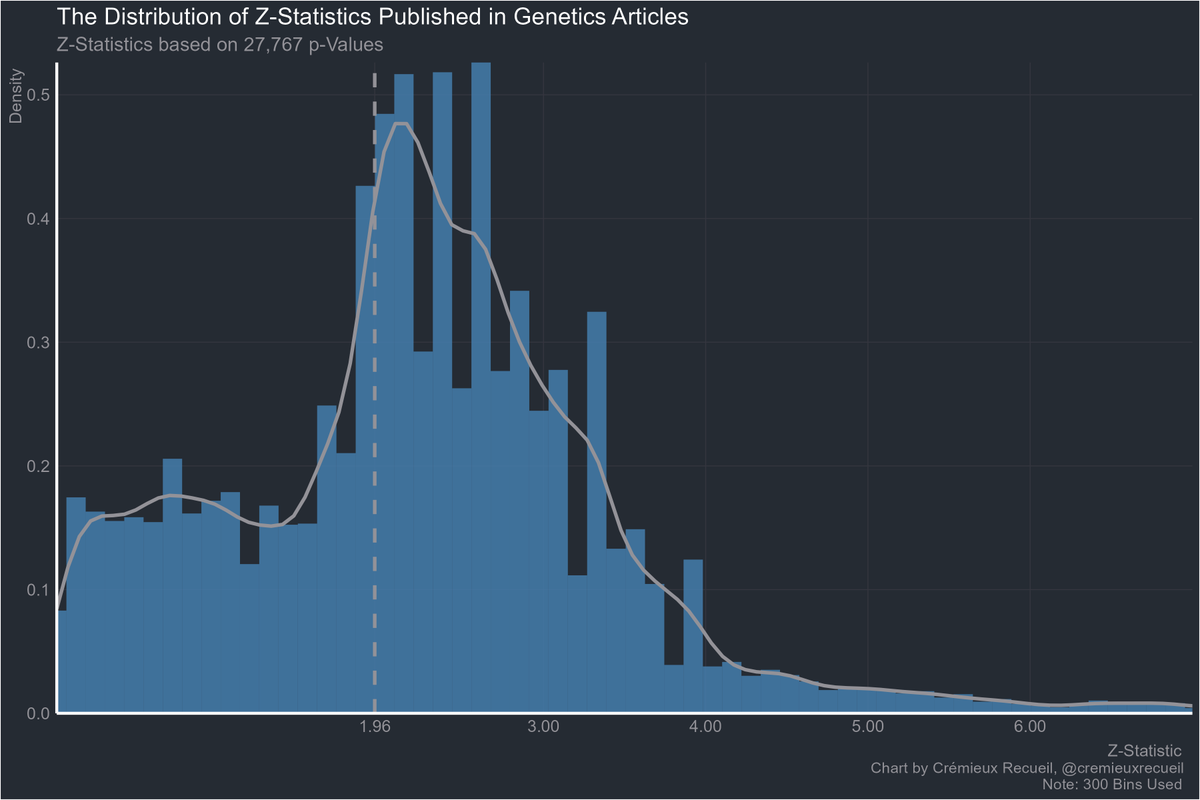
You've probably seen how this looks for economics before. There's a large excess of p-values that are just shy of the significance threshold. Image
But that's nothing. Economics hasn't committed anywhere near the level of sinning medicine has.

Medicine isn't even the worst offender and they're already this bad. Image
Since nutrition is what got me interested in this, here's how they fare:

Sorry about the scale, but that's just what p-hacking does. It's just that bad. Image
Now part of this may be down to economists reporting way more tests, and way more values, so their literature doesn't look as bad. But they still tend to focus on the marginal results that pile up near 0.05 even if they publish a bunch of less dodgy p-values.

No field is safe.
On the subject of p-hacking, this might be one of my favorite pictures showing how it works out: researchers don't report unless p < 0.05 and they prefer positive results.

To avoid confusion from people reporting p-values as inequalities, I have updated the charts in the piece to only include exactly-reported p-values.

Here's medicine, nutrition, plant biology, and computer science. ImageImageImageImage

• • •

Missing some Tweet in this thread? You can try to force a refresh
 

Keep Current with Crémieux

Crémieux Profile picture

Stay in touch and get notified when new unrolls are available from this author!

Read all threads

This Thread may be Removed Anytime!

PDF

Twitter may remove this content at anytime! Save it as PDF for later use!

Try unrolling a thread yourself!

how to unroll video
  1. Follow @ThreadReaderApp to mention us!

  2. From a Twitter thread mention us with a keyword "unroll"
@threadreaderapp unroll

Practice here first or read more on our help page!

More from @cremieuxrecueil

Apr 22
A lot of the clumping of p-values between 0.05 and 0.01 is because people report their p-values with inequalities.

If you just use exactly reported p-values, every field is still suspicious and they're still worse than economics.

What happens to the distribution in nutrition? Image
This is what @sguyenet asked about.

You can see things more clearly now because the clumping is much less extreme. But it's still very bad.

What about genetics? @wyclifsdust was shocked it looked that bad. A lot of that was down to inequality reporting. Image
It looks much better, but it's still very bad with exact reporting. Just look: the modal p-value is suspicious.

Read the full post here: cremieux.substack.com/p/ranking-fiel… Image
Read 4 tweets
Apr 21
Add Health Scarr-Rowe effect found!

- Cross-sectionally sig for parent edu and peer achievement at wave 1, age ~16
- Only cs sig for peer achievement at age ~22
- Only longitudinally sig for peer achievement
- Maybe parent edu moderation in non-URM pops

Peers may be a mechanism ImageImage
for Wilson effect into adulthood. But, hard to reconcile with lack of peer effects on means in this data. Analysis possibly confounded by IQ level moderation of heritability * age effects.

- no family income Scarr-Rowe

Once again, the most important aspect of SES is parent edu.
The test used had a reliability of 0.75-0.80, so it's worse than most cog tests, but using the uncorrected wave-averaged results, we get this addition to the Burt estimates plot:

So MZ twins were within ~1 point of the same person retesting.

Worth a read. GJ to @ent3c and team. Image
Read 4 tweets
Apr 21
Another round: Swedish edition.

In Sweden, parental education and IQ are related. But among international adoptees, there is no such relationship. Image
If we break out Korean versus non-Korean international adoptees, the results wrt edu are the same but Korean adoptees slightly outperform the average Swede and non-Korean international adoptees do not.

The low-high parent education gaps are not significant among adoptees. Image
But the power to detect the general population effect size is >0.999 in both adoptee samples. If there's a causal impact of parental education on kids' IQ scores, it's overestimated if you take the general population estimate for granted.
Read 5 tweets
Apr 18
If you aren't already, you should be following Amir. He's an excellent researcher who works with Nordic registry data and his within-family studies are incredibly high-quality and full of interesting facts.

In this one, he seems to have killed the idea epidurals cause ASD/ADHD.
If you look through his research, you will come away convinced that this man is worth a follow. Here's my case, just using his papers.

First, in a Finnish sample of 650,680 people, he found that the income-crime association disappeared within families.

academic.oup.com/ije/article/50… Image
In another large Finnish sample, with a total of 690,654 births, he found that the risk from maternal smoking during pregnancy also disappeared within families.

onlinelibrary.wiley.com/doi/full/10.11… Image
Read 14 tweets
Apr 18
Thanks to all of my 6,165 followers for following me. In a few minutes, my account will officially be 30 days old.

To mark the date, here's a thread of previous threads I've done and charts I've made to catch up new followers.
My first post was on ideal versus realized fertility. I found that the gap between women's actual and ideal numbers of kids grew with smarts. In other words, the smartest women were the most likely to have an unsatisfactorily low number of kids.

At the end of that thread, I posted fertility data for various groups in Denmark. As the chart showed, fertility has decreased for every group in the country, so now the most fertile - by a slim margin - are native Danes.

Read 121 tweets
Apr 18
So you have some twin data and you want to do some interpreting. If you don't have access to raw data, it's easy to do some approximating to get a feel for the similarity or dissimilarity of people at different degrees of relatedness.

Here's code for a hypothetical dataset. Image
In this data, the reliability leads to a personal difference of 5.35 points between testings. For corrected MZ, DZ, half-sib, and adoptees, you'd get 8.67, 12.27, 14.53, and 15.04 points. Assuming unrelated people are uncorrelated, they tend to vary by 16.93 points.
This approximation works really well, and the higher the correlation, the better it performs. I invite you all to simulate it.

Here are four plots showing that it works well with sample sizes of 100,000, 1,000, 250, and even 100.

I wasn't interested in facetwrapping. ImageImageImageImage
Read 4 tweets

Did Thread Reader help you today?

Support us! We are indie developers!


This site is made by just two indie developers on a laptop doing marketing, support and development! Read more about the story.

Become a Premium Member ($3/month or $30/year) and get exclusive features!

Become Premium

Don't want to be a Premium member but still want to support us?

Make a small donation by buying us coffee ($5) or help with server cost ($10)

Donate via Paypal

Or Donate anonymously using crypto!

Ethereum

0xfe58350B80634f60Fa6Dc149a72b4DFbc17D341E copy

Bitcoin

3ATGMxNzCUFzxpMCHL5sWSt4DVtS8UqXpi copy

Thank you for your support!

Follow Us on Twitter!

:(