I write about genetics, 'metrics, and demographics.
Read my long-form writing at https://t.co/8hgA4nNS2A.
 The Turks are for the three who challenged him to duels, all of whom he beheaded.
 Want a version with logged axes so you can actually see data centers?
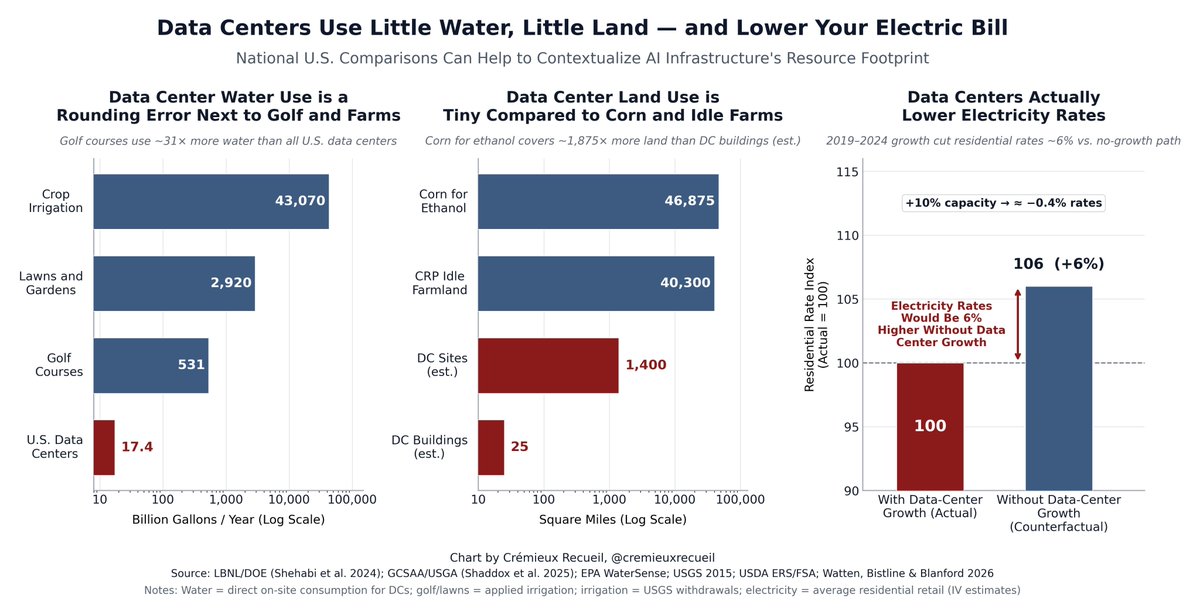
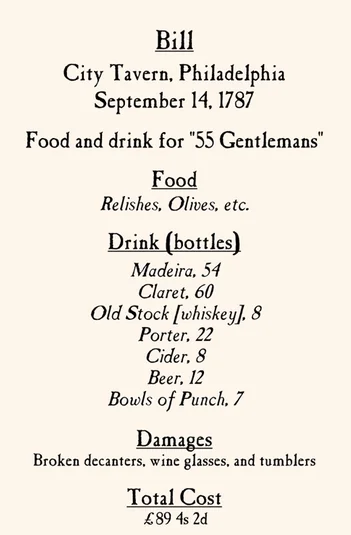
 Our Colonial forebears "swam in a sea of booze from breakfast till bedtime".
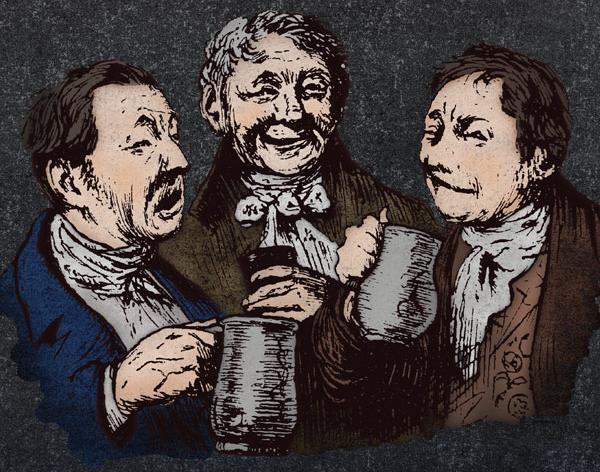
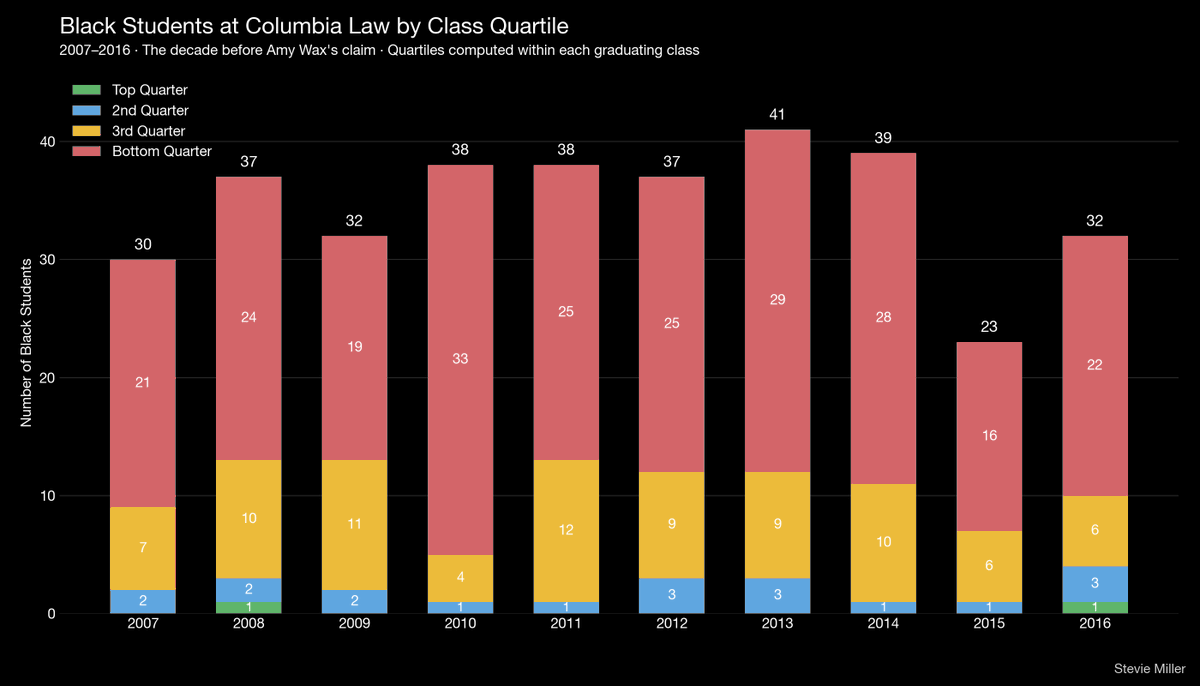 It is *totally* plausible that she never met these students. And it's also plausible that she rarely saw Black students in the top *half*, because each year, the number of them was just 1-4.

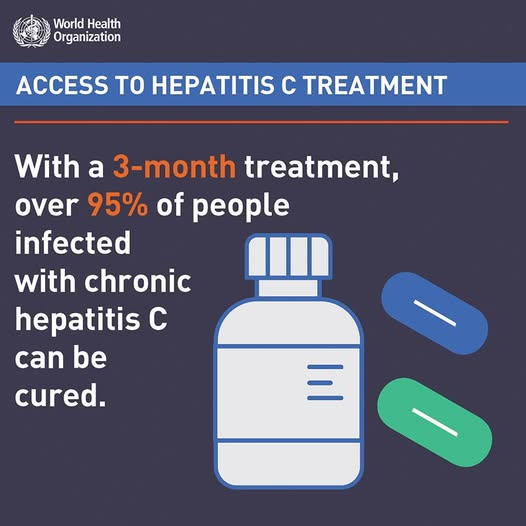 Peptic ulcers are now curable in more than 90% of patients via antibiotic triple/quad therapy (1994).
 Some people argue against plasma donation on the basis of it being disproportionately used by poorer people
 In 1982, Randy Shilts published his biography of Harvey Milk, entitled "The Mayor of Castro Street".
 They loved life and they fought, wrestled, and in some cases, even shot each other.
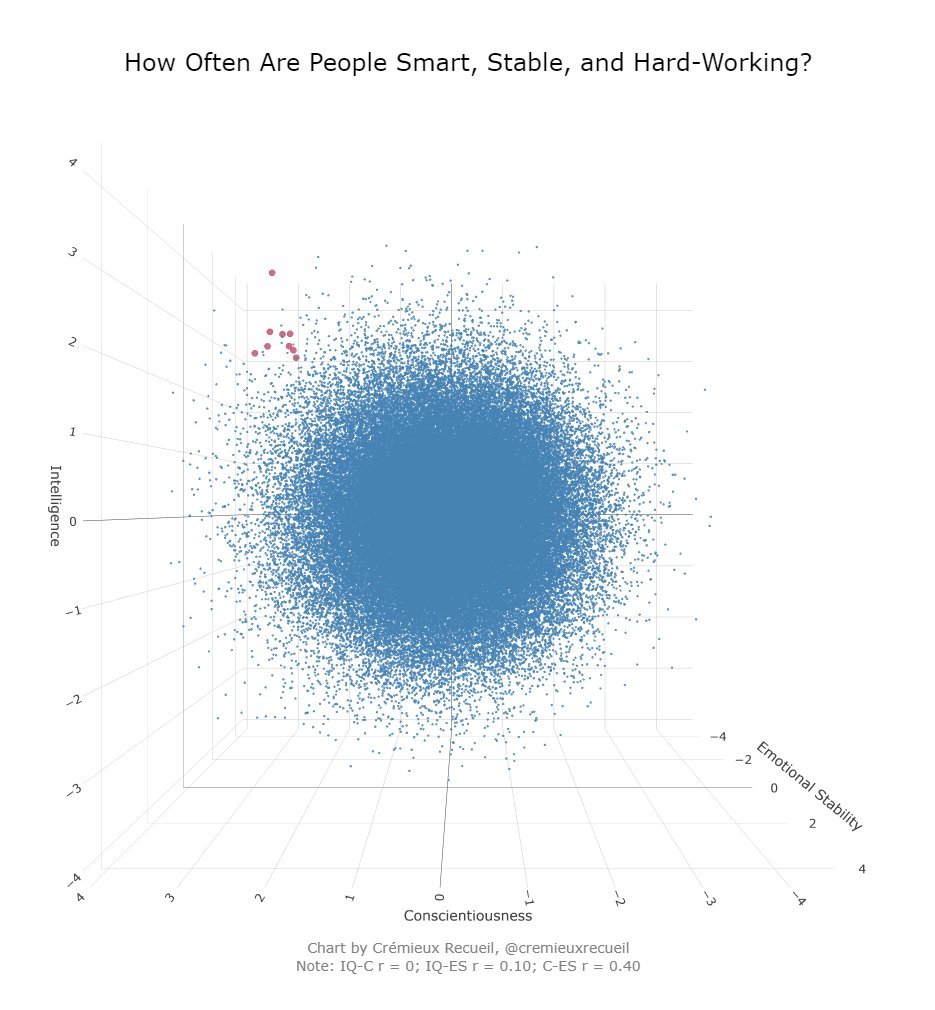
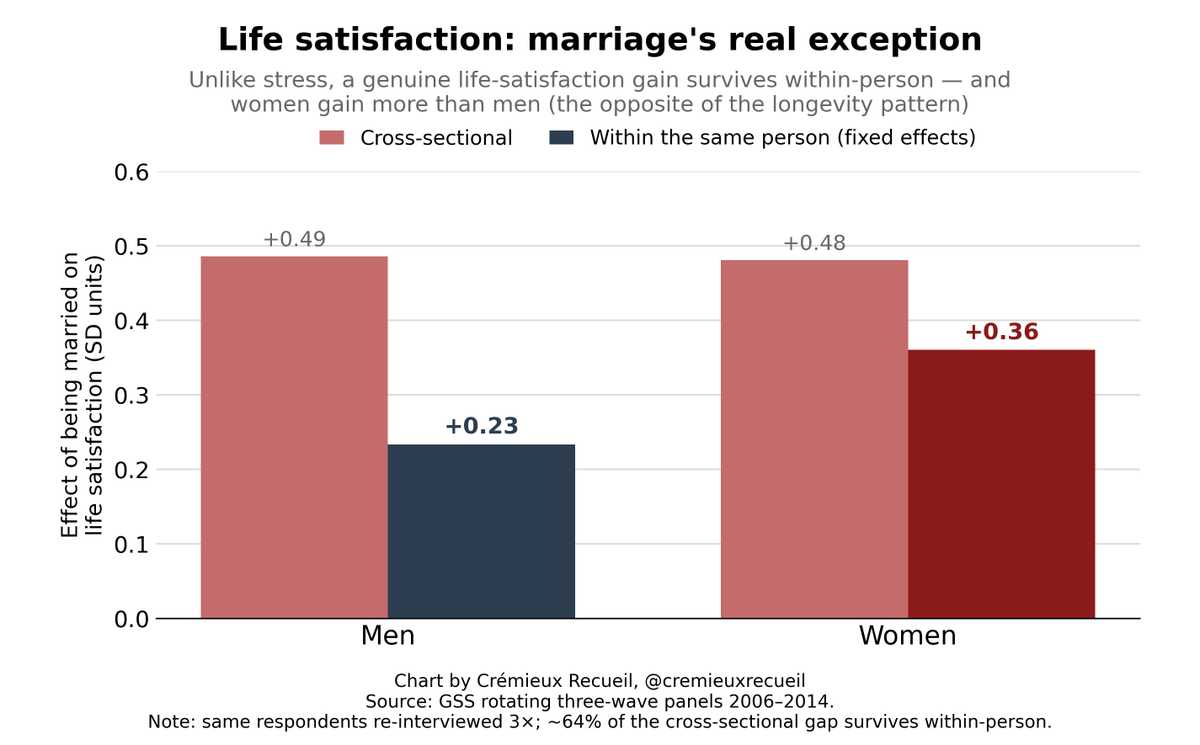 In that chart, I used the GSS and found something many people replicate:
 And remember, Eli Lilly's big break historically was the University of Toronto licensing them to produce insulin.
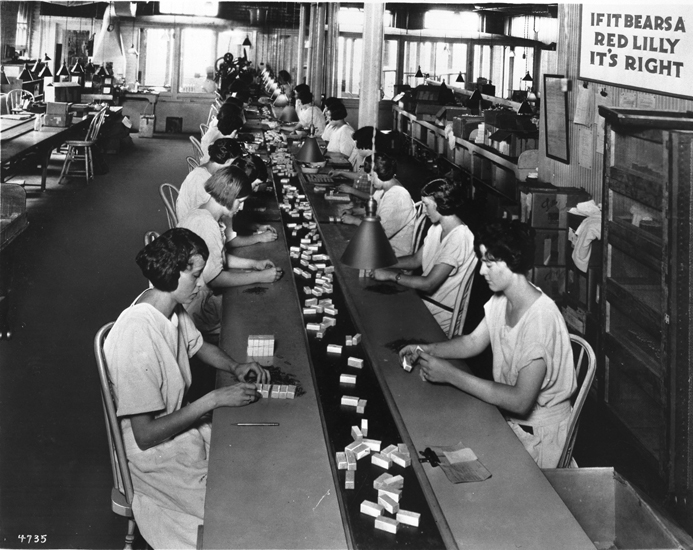
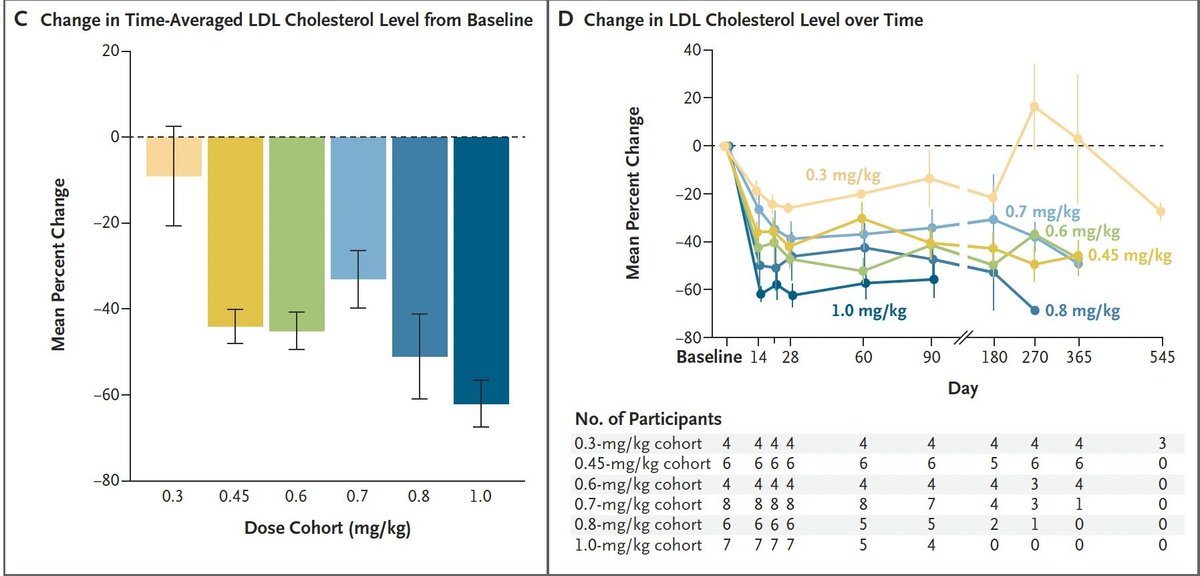 Almost all of the side effects were just things you see with any infusion. Some people react poorly to needles and having to sit for a while🤷♀️
  This claim doesn't make a lot of sense. After all, shouldn't the primary beneficiaries of affirmative action be the people who the policies primarily target?
 To figure out the innovation effects of losing a large portion of a generation's young men who were just coming into the primes of their lives, the authors needed four pieces of data.
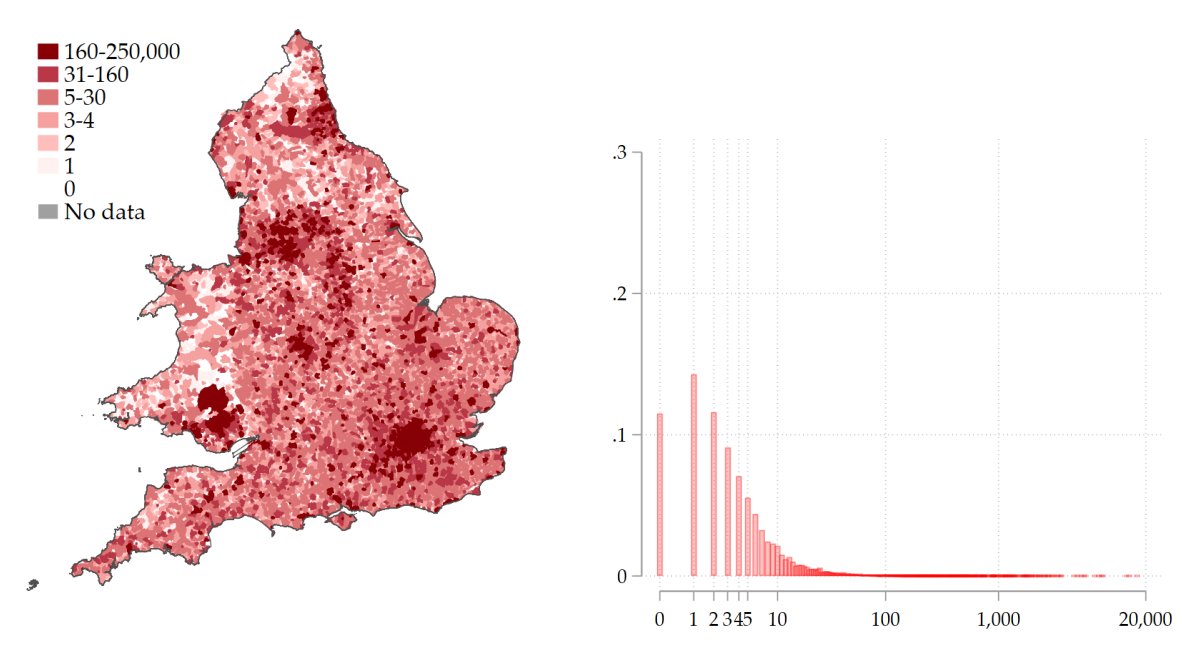
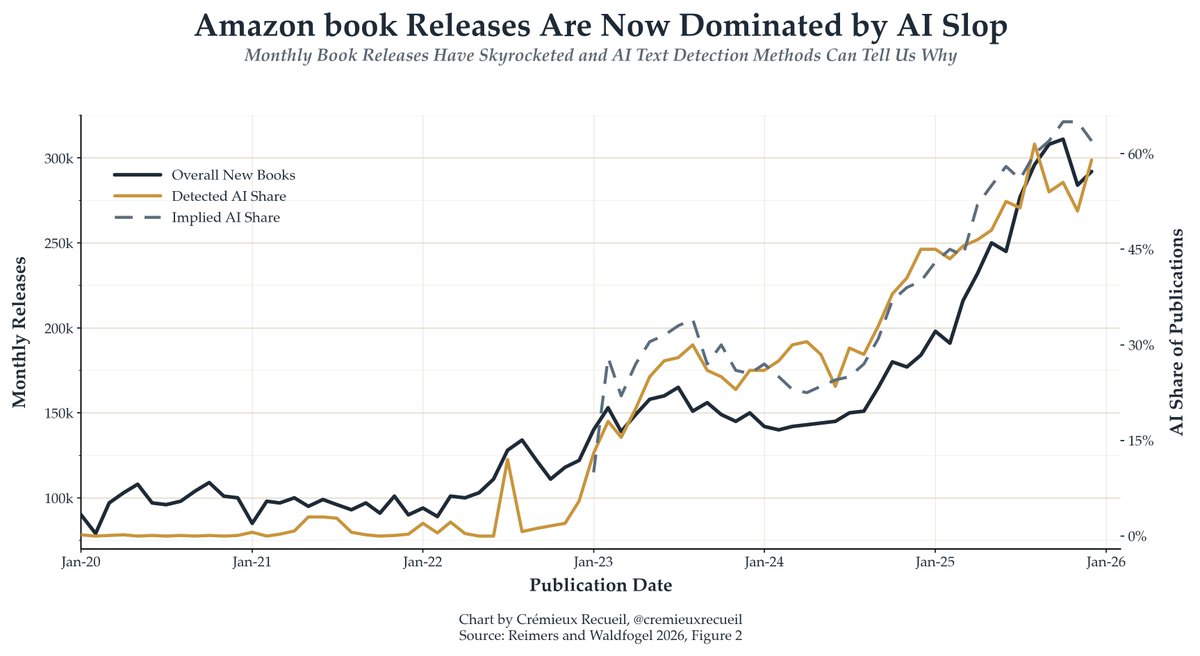 Similarly, the rise of pro se litigants has come with a rise in case filings detected as being AI-generated, and with virtually zero false-positives before AI was around.
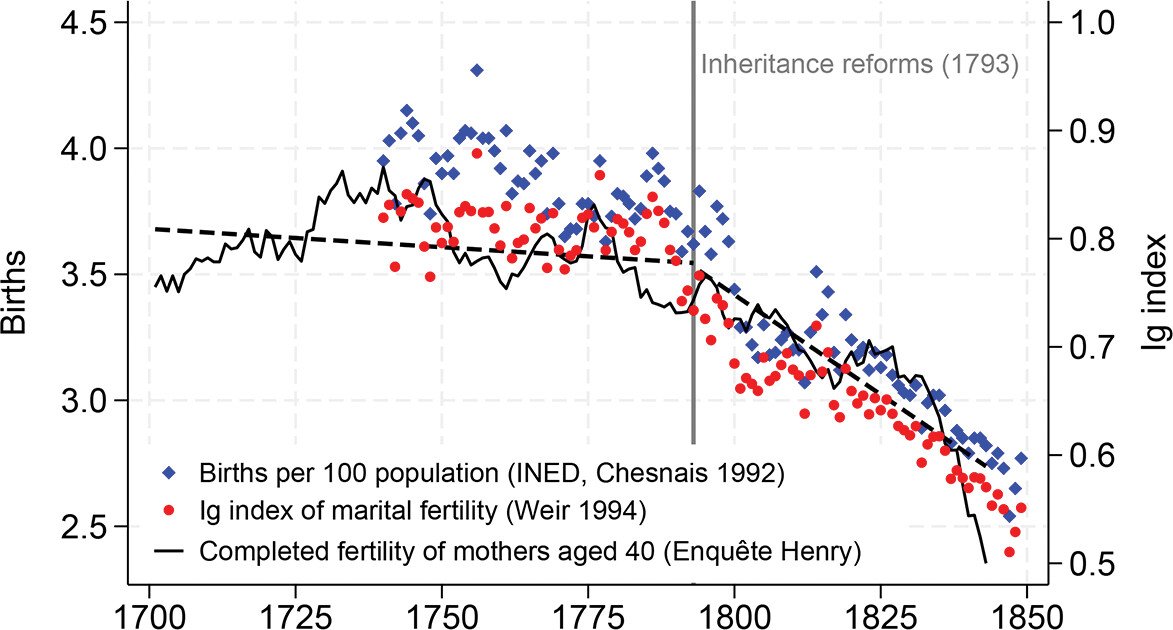 For reference, the French Revolution ushered in a number of egalitarian laws.
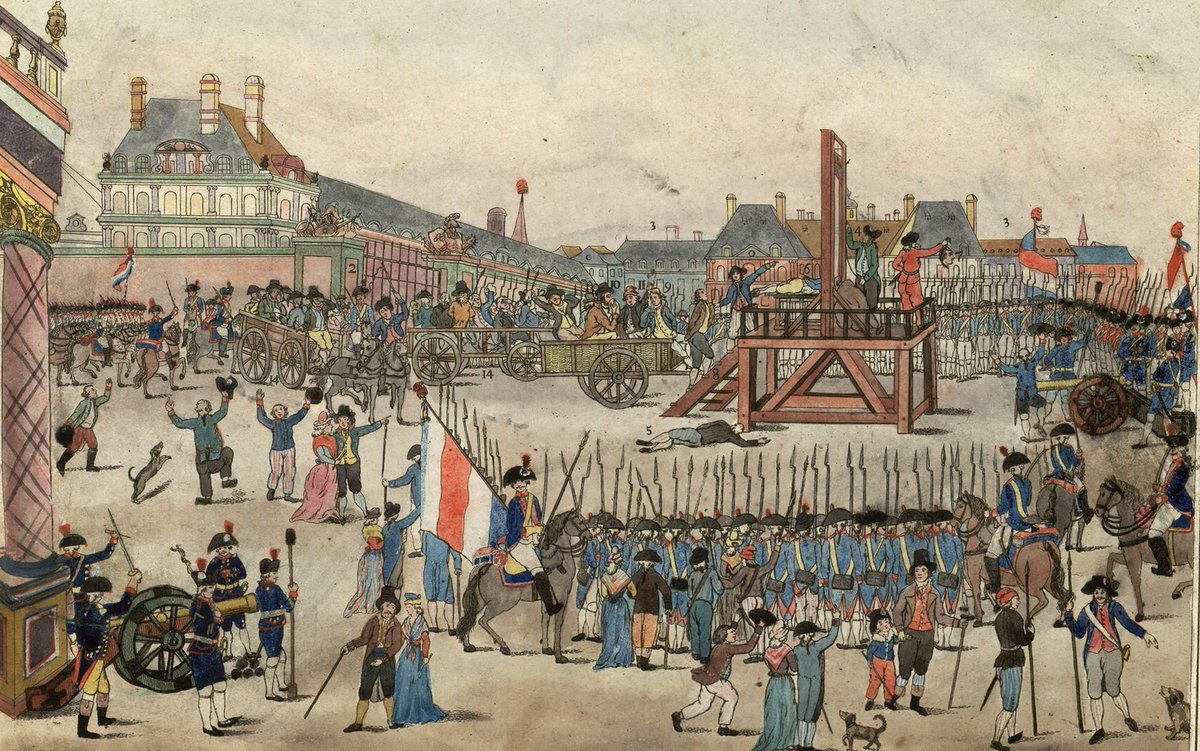
 Early on, a lot of this dissimilarity is due to hysteresis.
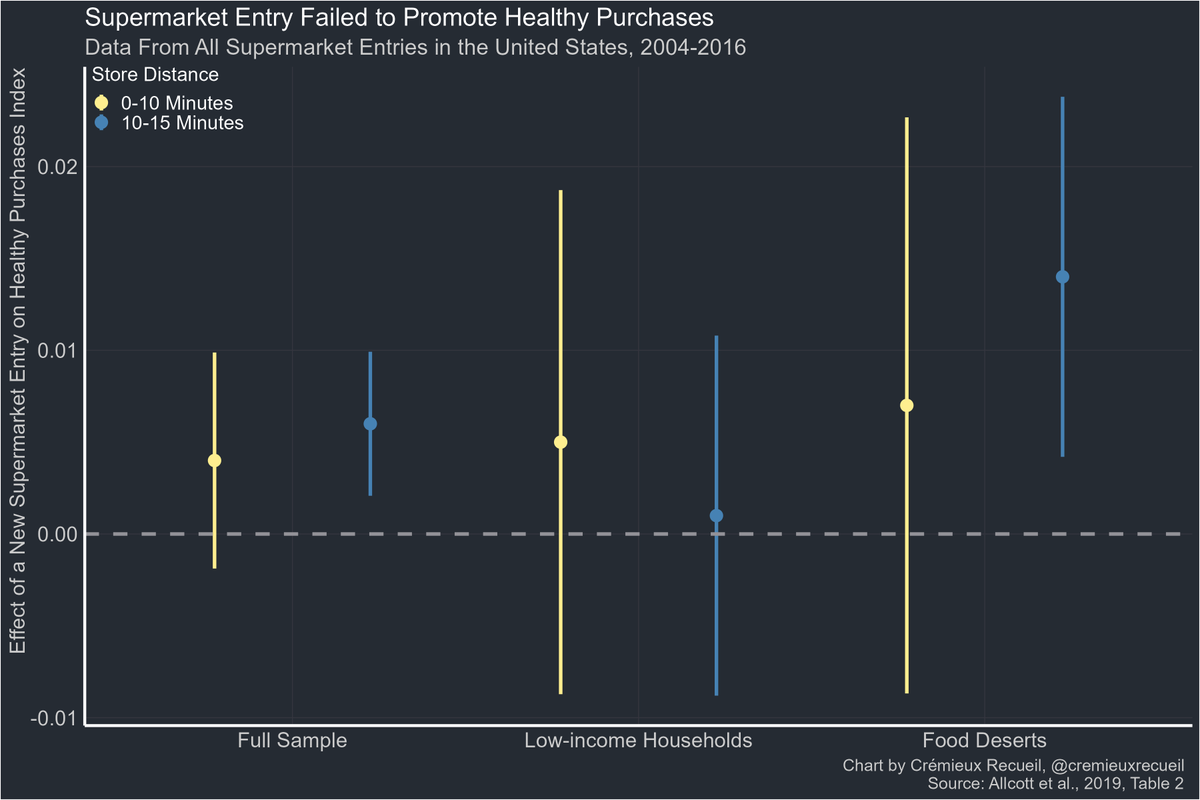 The significant effects are probably not meaningful. They're more likely under the null with this gigantic dataset (p's of 0.003 and 0.005 with a total sample size of ~2.9m)
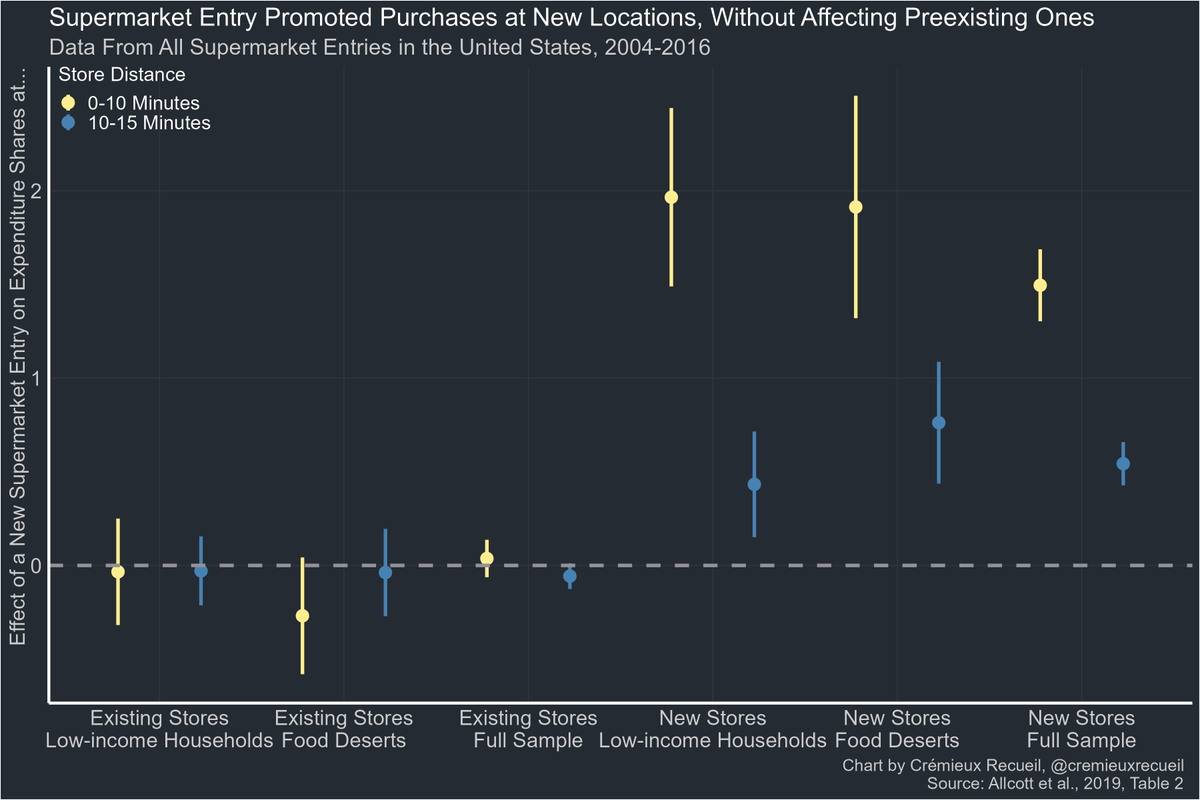
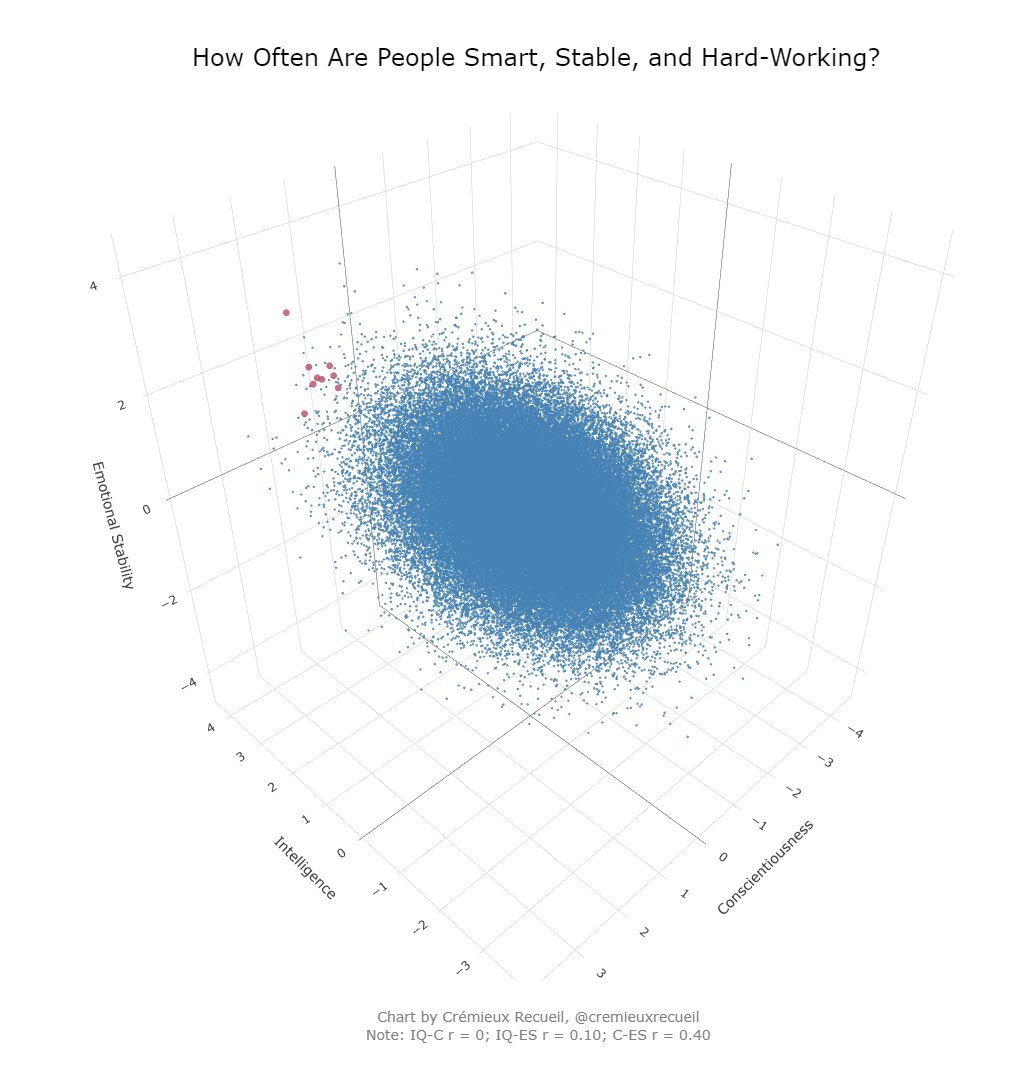 If you reorient the chart to a bird's eye view, it looks like this: