#CNXIT History of IT Sector in India: A data-based perspective
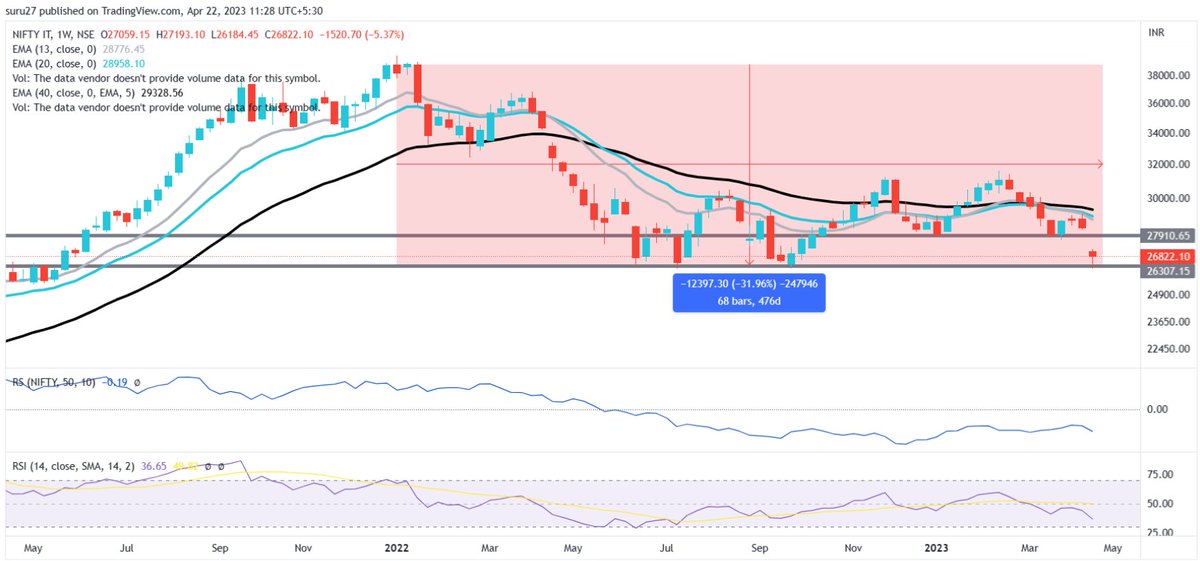
In last 1.5 years, we witnessed a heavy price correction in IT sector. This is evident from CNXIT index movement which is 32% down in last 1.5 years (we kept cautioning repeatedly then)
In last 1.5 years, we witnessed a heavy price correction in IT sector. This is evident from CNXIT index movement which is 32% down in last 1.5 years (we kept cautioning repeatedly then)

Now, sector is also facing headwinds. Typically, this is how market behaves. Market is always ahead of reality. It tops when valuations highlight major froth, smart money slowly exits n new entrants think they know it all, are scapegoats. Companies r lowering their guidance. 


Within a year, we have come from healthy double digit growth to low to mid single digit growth projection. Question is - Is it something new or there is something to learn from history?
History is an interesting subject and price is the first guide. Lets us look at history
History is an interesting subject and price is the first guide. Lets us look at history
When we look at IT index history, we realize that current correlation is not 1st one. The last major correction happened in 2014-16 when CNXIT was 25% down for 2 years. This was the time when current 50x stocks were available at 15x and still there was lot of pessimism. 

Do you know why CNXIT went through such correction? Let me give you some hints. Below is the table which provides global IT spending data for last 19 years. Look what happened to global IT spending during 2014-16 period on 1- and 3-year CAGR. It went through its worst -2 to -5% 

Also, what is noteworthy about it is that 2021 was a year of record high global IT spending. The last such spending happened just before 2008 recession. Now, again, we are talking about recession. Call it co-incidence or whatever but data always throws important stuff. 

Let me throw one more interesting data stuff. I tried to find correlation between global IT spending YoY growth rate and few more indicators and found 91% strong correlation between global IT spending YoY growth and this indicator. 

This is just one of the interesting insights among many we are covering in our IT sector super session where we already had 1 session and there are 2-3 more sessions planned to cover this sector in utmost detail. Want to know more, join us here: learn.scientificinvesting.in/learn/IT 

End of thread. Like and retweet if you like our work and data driven approach to decipher facts - fundamental, technical, quants @ScientificInve6
Link to Webinar: learn.scientificinvesting.in/learn/IT
Link to Webinar: learn.scientificinvesting.in/learn/IT
• • •
Missing some Tweet in this thread? You can try to
force a refresh


