1-Intercropping is the practice of growing more than one crop on the same field at the same time in a definite row pattern.
A-Row Intercropping
When the component crops are arranged in alternate rows it is known as row intercropping.
B-Strip Intercropping
When two or more crops are grown in wide strips so that the two crops can be managed separately, it is known as strip cropping.
C-Relay Intercropping
In this type of intercropping, a second crop is planted when the existed crop has flowered but not harvested. For eg., Rice-Cauliflower-Onion-Summer gourds.
1-RECESSION
Recession refers to a phase of the downturn in the economic cycle when there is a fall in the country’s GDP for some quarters.
‘A recession is a period of decline in total output, income, employment and trade, usually lasting six months to a year.’
#2 DEPRESSION
When recession, turns out to be more severe and continues for a long term.
A common rule of thumb for depression is a negative GDP of 10% of more, for more than 3 years.
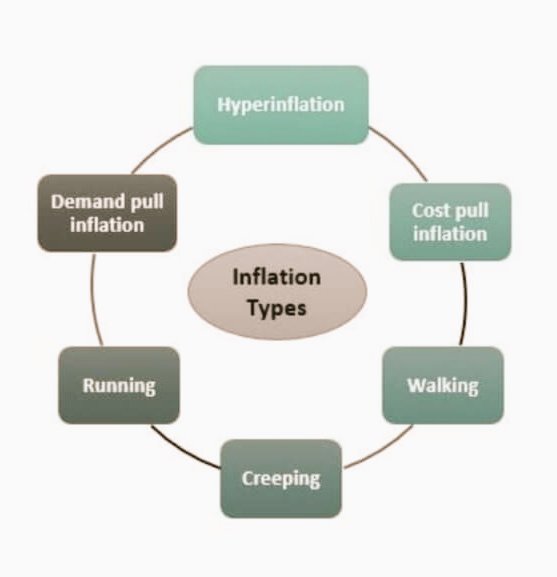
Some other inflation term-
#1 Structural inflation
#2 Disinflation
#3 Deflation
#4 Open inflation
#5 Repressed/supressed inflation
#6 Skewflation
#7 Stagflation
#8 Core Inflation
#9 Headline inflation
See below👇
#1 Structural Inflation- Developing and Low-Income Countries.
Example:In India,let’s assume that the farmer produces fruits and vegetables at 10000 per quintal.But the final consumer gets the same at 20000 per quintal.Huge disparity between what farmer receives and consumer pays
#2 Disinflation-Disinflation is a situation in which the rate of inflation falls over a period of time. Remember the difference; disinflation is when the inflation rate is falling from say 5% to 3%.
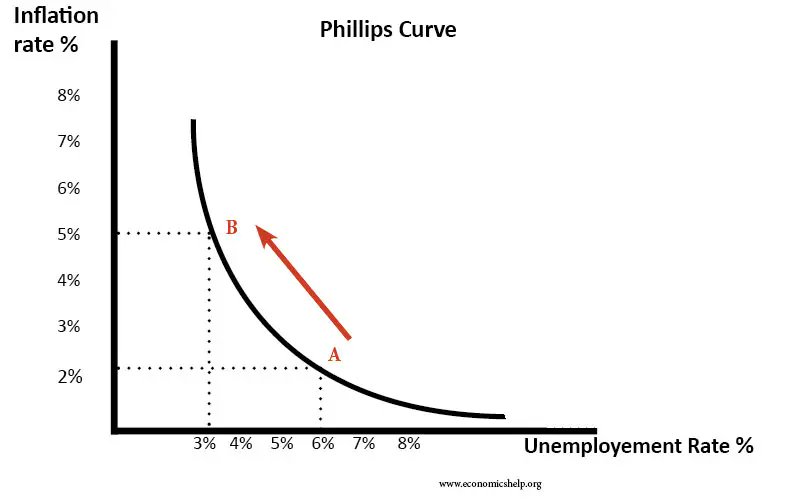
#1 Demand pull infation-If aggregate demand (AD) rises faster than productive capacity,then firms will respond by putting up prices,creating inflation.
See below 👇
A rise in demand causes a fall Unemployment (from 6% to 3%) but an increase in inflation from inflation of 2% to 5%
#2 –Creeping Inflation a condition where the inflation in a country increases slowly but continuously over a period of time and the effect of inflation is noticed after a long period of time.
Ex-if the inflation is at the rate of 3% it will take 33 years for the prices to double.
List of Important Curves In Economics :
1-Lorenz Curve
2-Gini Coefficient
3-Kuznets Curve
4-Laffer Curve
5-Philips Curve
See in detail👇
1-Lorenz Curve is a graphical distribution of wealth. It shows the proportion of income earned by any given percentage of the population.
It was developed by Max Lorenz in 1905.
The given figure shows that 20% of people earns only 5% of income.
2-Gini Coefficient
The Gini Coefficient, which is derived from the Lorenz Curve, can be used as an indicator of economic development in a country.
Its value varies anywhere from zero to 1, zero indicating perfect equality and one indicating the perfect inequality.