Powerful INVESTING STRATEGY that helped me..🎯
• Identify turning points in stocks
• Find quality stocks
• Not panic & ride trends
• Finally make 💸
CCI & Pivot Strategy🧵..
Ready to learn?🤓
Let's go...🧵
• Identify turning points in stocks
• Find quality stocks
• Not panic & ride trends
• Finally make 💸
CCI & Pivot Strategy🧵..
Ready to learn?🤓
Let's go...🧵

1⃣ How to filter stocks? Is there a scanner?
There are 1000s of stocks in the market & you need to invest in only a few.
How do you narrow it down to a select few?
Use this simple CCI based scanner (CCI Weekly crossing 100) every weekend👇
chartink.com/dashboard/34179
There are 1000s of stocks in the market & you need to invest in only a few.
How do you narrow it down to a select few?
Use this simple CCI based scanner (CCI Weekly crossing 100) every weekend👇
chartink.com/dashboard/34179
2⃣ Which stock to select from the scanner?
In @screener_in
• ROCE should be > 10
• Ratio of Stock P/E to ROCE should be < 2
• D/E ratio should be < 1
• Sales & PAT should be in uptrend continuously
Consider only those stocks that meet at least the first 3 criteria.
In @screener_in
• ROCE should be > 10
• Ratio of Stock P/E to ROCE should be < 2
• D/E ratio should be < 1
• Sales & PAT should be in uptrend continuously
Consider only those stocks that meet at least the first 3 criteria.

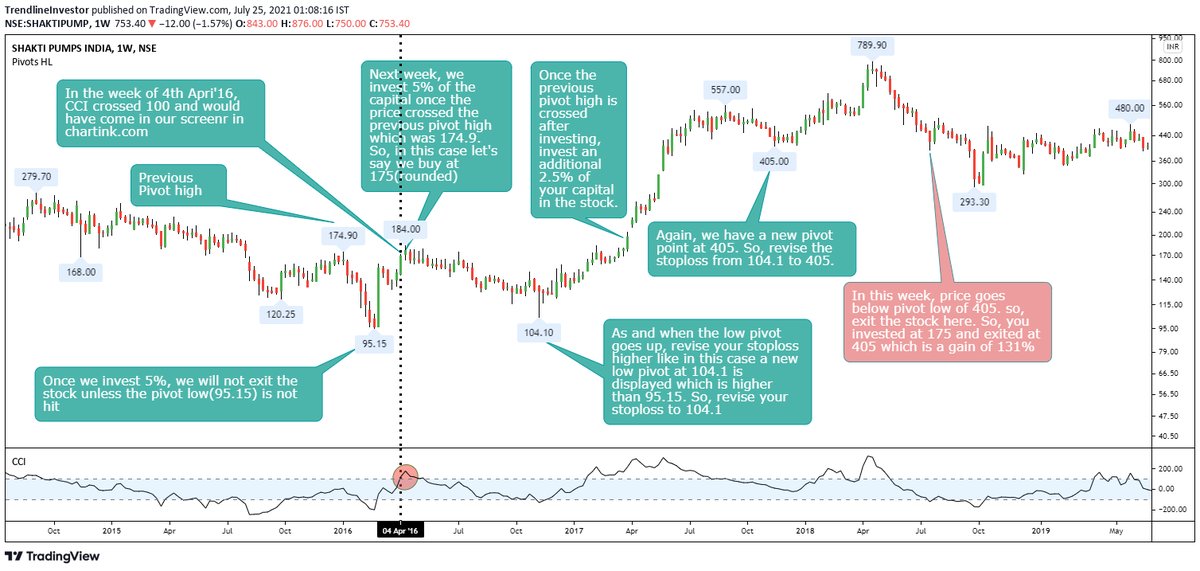
3⃣ When to invest?
In @tradingview @in_tradingview
• Identify the previous pivot high for the stock on weekly TF
• In the below case of Shakti pumps, the previous pivot high was 174.9. Only buy the stock above this high next week.
• Once bought trail stop to pivot low
In @tradingview @in_tradingview
• Identify the previous pivot high for the stock on weekly TF
• In the below case of Shakti pumps, the previous pivot high was 174.9. Only buy the stock above this high next week.
• Once bought trail stop to pivot low

4⃣ How much to invest?
• Invest only 5% of your capital in the stock i.e. if you have 1 lakh capital, invest only 5000 in one stock
• Do not invest in more than 20 stocks
• Remember, the more the number of stocks the lesser the probability of higher returns
• Invest only 5% of your capital in the stock i.e. if you have 1 lakh capital, invest only 5000 in one stock
• Do not invest in more than 20 stocks
• Remember, the more the number of stocks the lesser the probability of higher returns
5⃣ When to add more?
• After investing initial 5% in a stock wait for a new pivot high to be formed
• Once the new pivot high is crossed, invest another 2.5% of capital
• Allocate only 7.5% (5% the 1st time & 2.5% the 2nd time) of capital in one stock.
Refer 👇
• After investing initial 5% in a stock wait for a new pivot high to be formed
• Once the new pivot high is crossed, invest another 2.5% of capital
• Allocate only 7.5% (5% the 1st time & 2.5% the 2nd time) of capital in one stock.
Refer 👇

6⃣ When to exit?
• Whenever the price goes below the previous pivot low, you MUST exit the stock no matter what and find the next opportunity and move on
Refer 👇
• Whenever the price goes below the previous pivot low, you MUST exit the stock no matter what and find the next opportunity and move on
Refer 👇
7⃣ Pros of this strategy
• Chance of you losing a major part of capital is very less
• Peaceful method to invest even if you have a full-time job
• Filter conditions mentioned will ensure quality companies are held and hence higher chance of multifold returns
• Chance of you losing a major part of capital is very less
• Peaceful method to invest even if you have a full-time job
• Filter conditions mentioned will ensure quality companies are held and hence higher chance of multifold returns
8⃣ Cons of this strategy
• Not a get rich quick strategy
• Need patience and discipline when the stock is going down after gaining very well.
• Remember, we are looking for multi-baggers – so, you will have to experience some decent moves down for some great moves up
• Not a get rich quick strategy
• Need patience and discipline when the stock is going down after gaining very well.
• Remember, we are looking for multi-baggers – so, you will have to experience some decent moves down for some great moves up
Learnt something? If yes, please👇
1. Retweet the first tweet
2. Follow @dmdsplyinvestor
3. Subscribe to my YouTube channel for more content! youtube.com/c/TrendlineInv…
1. Retweet the first tweet
https://twitter.com/dmdsplyinvestor/status/1651136143822315520?s=20
2. Follow @dmdsplyinvestor
3. Subscribe to my YouTube channel for more content! youtube.com/c/TrendlineInv…
• • •
Missing some Tweet in this thread? You can try to
force a refresh