Despite all the talk about how the world is standing in the way of China's growth, the world (including the US) continues to supply China with one thing it cannot generate domestically -- demand for its manufactures.
China's surplus again topped 10% of its GDP.
1/x
China's surplus again topped 10% of its GDP.
1/x

Even with relatively high commodity prices, China's overall trade surplus (in goods) is approaching its pre-global financial crisis peak. As is the surplus in manufacturing.
Even scaled to China's GDP
2/
Even scaled to China's GDP
2/

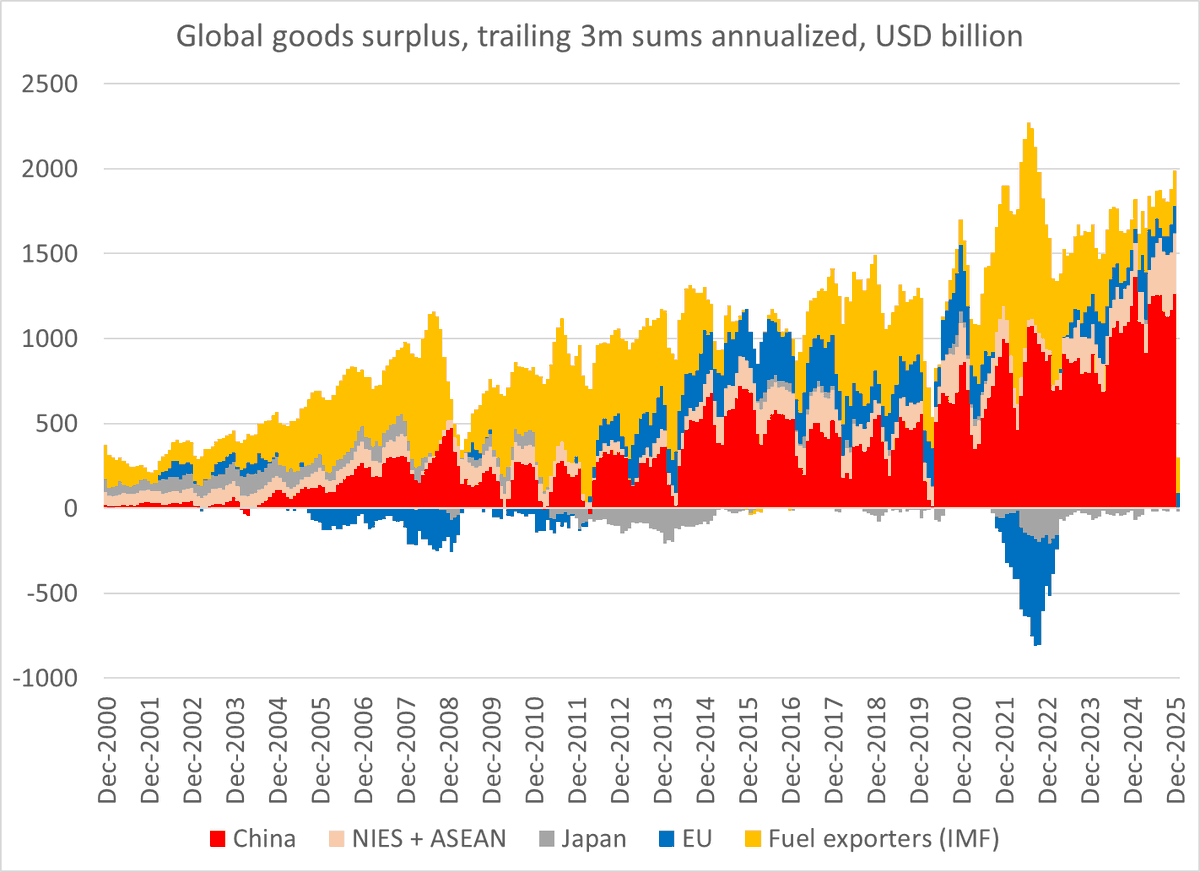
And of course in dollars the surplus is WAY bigger than it was prior to the global financial crisis (dollars are an OK proxy for scaling the surplus v the size of its trading partners).
The world still supplies China with a ton of net demand.
3/
The world still supplies China with a ton of net demand.
3/

What is striking - at least to me - is how rare it is for China's surplus in manufacturing to shrink. It happened after the global financial crisis & after the '15 commodity crisis + USD/ CNY appreciation. But not after the Trump tariffs/ COVID ... rather the contrary
4/
4/

Imports of manufactures have also been squeezed out of China's market over time -- I don't know anyone who forecast at the time of China's WTO accession that it would eventually in result in a 5 pp fall in China's manufactured imports v its GDP
5/
5/

China simply doesn't import many manufactures for its own use (it imports chips for reexport) ...
Net of processing imports, exports are about 14% of GDP and manufactured imports are now under 4% of GDP.
This is true "deglobalization"
6/
Net of processing imports, exports are about 14% of GDP and manufactured imports are now under 4% of GDP.
This is true "deglobalization"
6/

China couldn't run these kinds of surpluses globally without the big US deficit in manufactures -- we don't yet trade with Mars (& I increasingly doubt that Elon is gonna let us start)
China may complain about the chip restrictions, but the US is still helping it grow ...
7/
China may complain about the chip restrictions, but the US is still helping it grow ...
7/

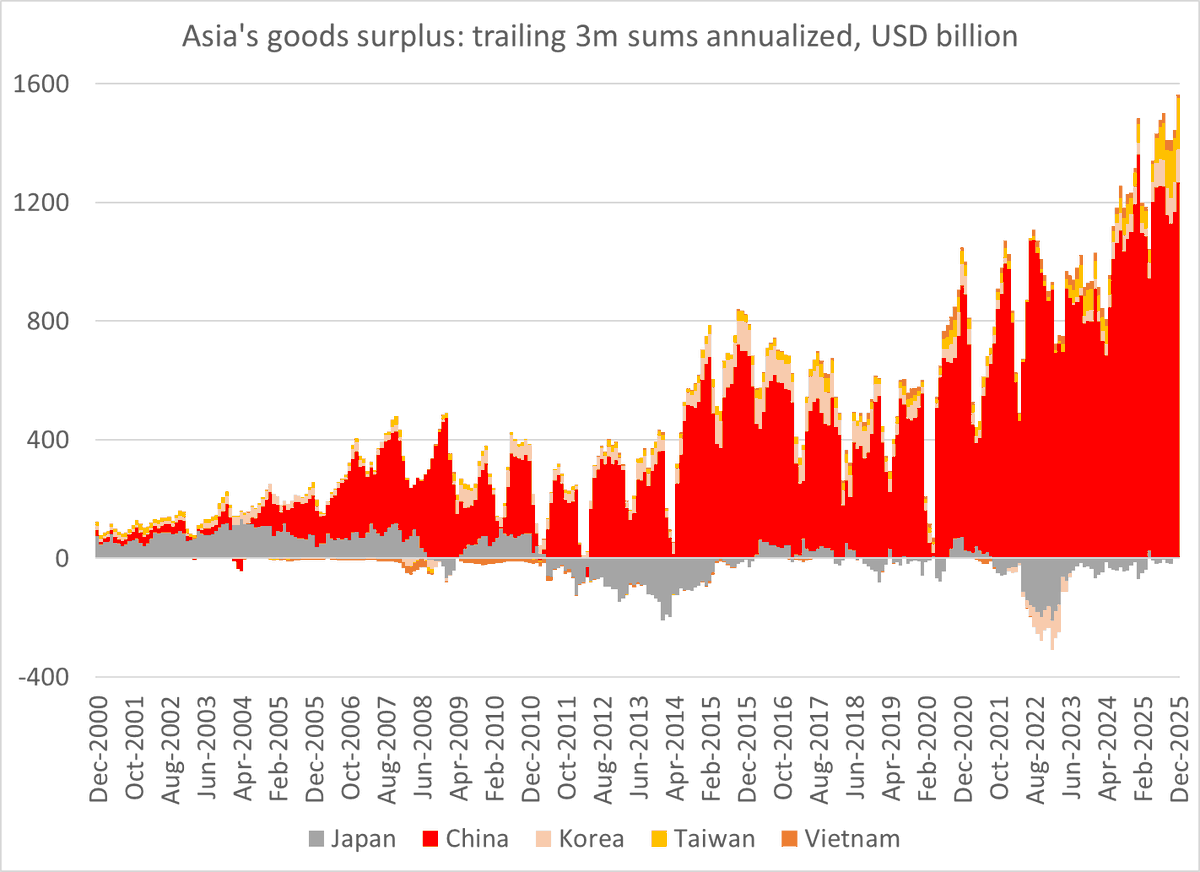
But China doesn't just rely on the US to supply it with net demand for its manufactures that it cannot generate internally.
This chart, together with the charts on China's sudden emergence as a net exporter of autos, should prompt a bit of reflection in Europe ...
8/8
This chart, together with the charts on China's sudden emergence as a net exporter of autos, should prompt a bit of reflection in Europe ...
8/8

• • •
Missing some Tweet in this thread? You can try to
force a refresh