Academics hate doing graphic design.
But visualizations, diagrams, and figures elevate any paper.
Here's how I use ChatGPT to create TikZ figures unlike anyone else. ↓
But visualizations, diagrams, and figures elevate any paper.
Here's how I use ChatGPT to create TikZ figures unlike anyone else. ↓
In this thread, I will teach you:
• how to add beautiful diagrams simply by describing them
• without any coding skills but using a LaTeX package
• how to work ChatGPT to do the coding for you
• how to format the diagrams
And more...
Let's dive in.
• how to add beautiful diagrams simply by describing them
• without any coding skills but using a LaTeX package
• how to work ChatGPT to do the coding for you
• how to format the diagrams
And more...
Let's dive in.
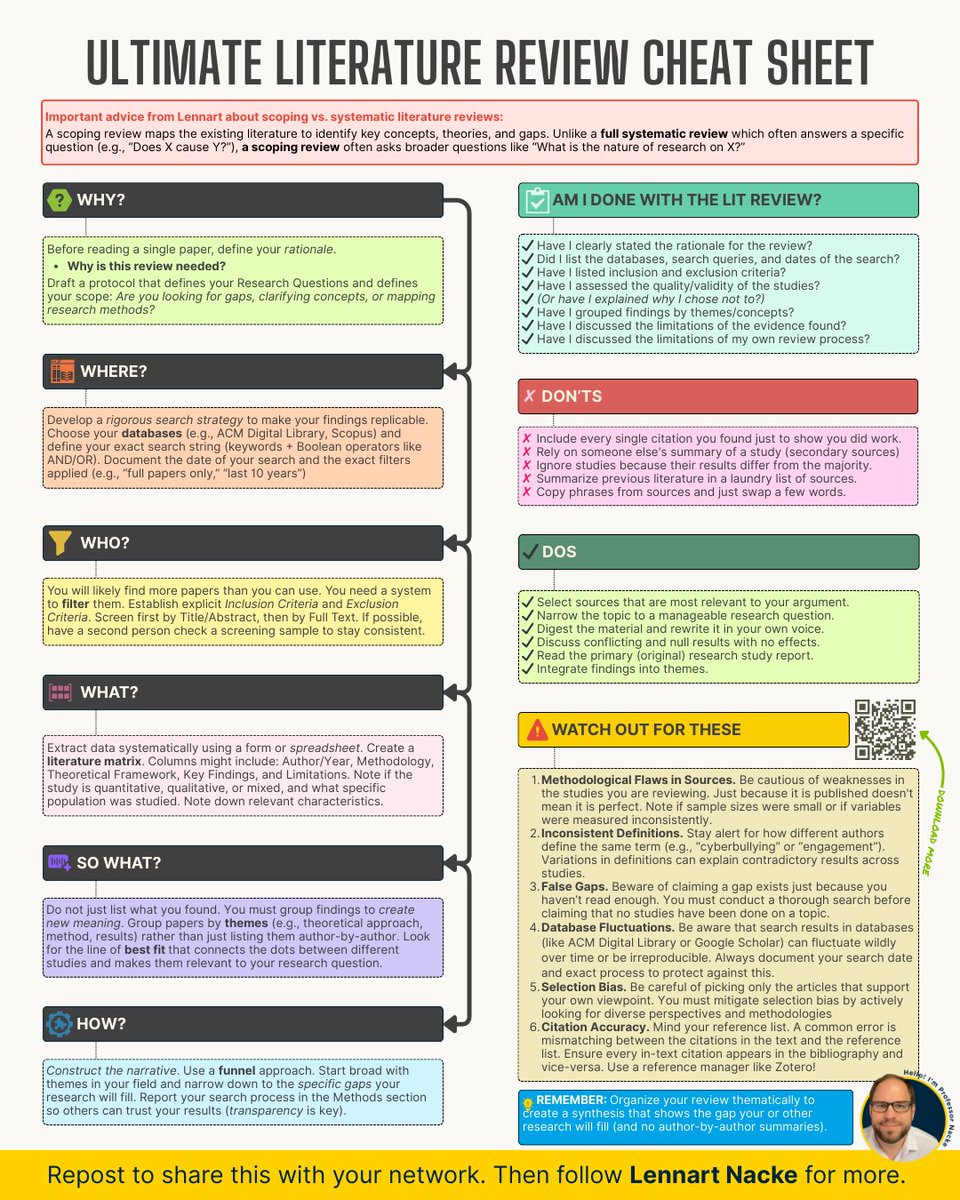
Here's the figure we are going to create:
It's a simple experimental flow diagram.
This helps you describe pre and post conditions
And flow through your experimental design.
It's a simple experimental flow diagram.
This helps you describe pre and post conditions
And flow through your experimental design.

LaTeX is a markup language that is popular for scientific publications.
It makes it easy to reference in different format and citation styles.
The TikZ package allows you to create diagrams using text only.
I use a free online editor called @overleaf to edit my papers.
It makes it easy to reference in different format and citation styles.
The TikZ package allows you to create diagrams using text only.
I use a free online editor called @overleaf to edit my papers.
Creating a TikZ figure can take time for someone not prolific in coding.
I have this problem, and I get lost in tinkering around with the code.
Let's focus on building the figure we want instead.
Enter ChatGPT, your coding assistant.
Here's is how to use it for TikZ:
I have this problem, and I get lost in tinkering around with the code.
Let's focus on building the figure we want instead.
Enter ChatGPT, your coding assistant.
Here's is how to use it for TikZ:
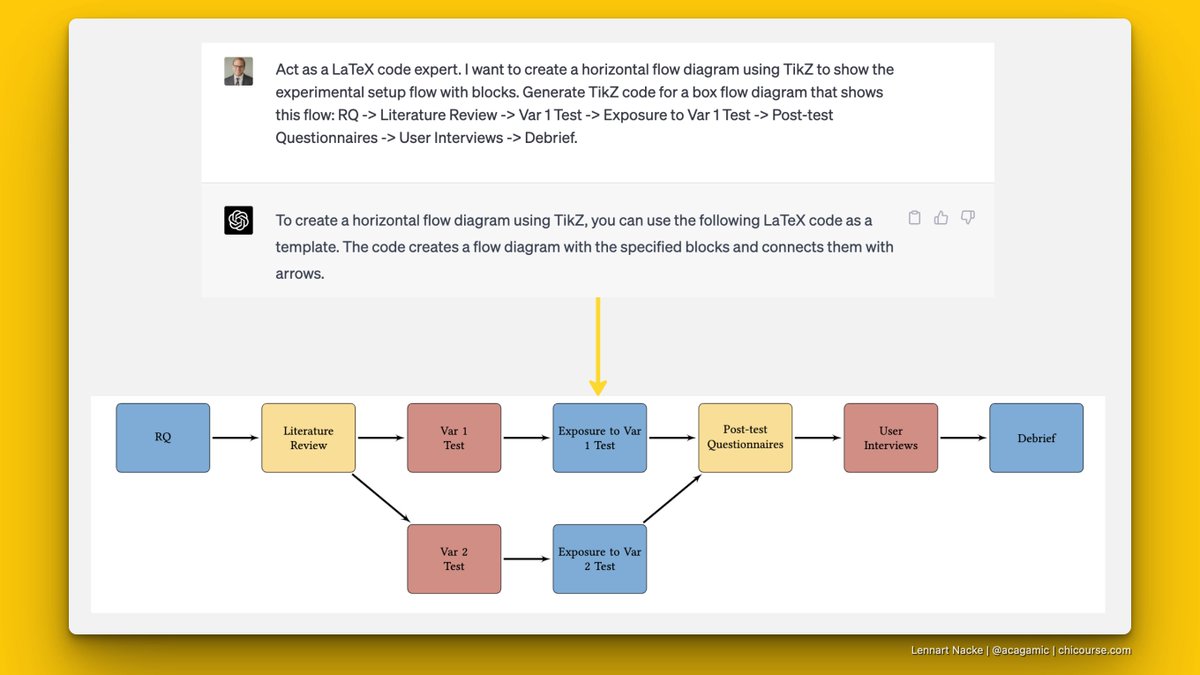
First, I draw the diagram or think about how it should look like.
Then, I prompt ChatGPT with the details:
• Act as a LaTeX expert
• Create a horizontal box flow diagram with TikZ
• Describe the flow or sequence of the diagram in detail
See figure for the prompt and output.
Then, I prompt ChatGPT with the details:
• Act as a LaTeX expert
• Create a horizontal box flow diagram with TikZ
• Describe the flow or sequence of the diagram in detail
See figure for the prompt and output.

Make sure to include the usepackage and usetikzlibrary in the header.
The code output is operational already.
You can put it in Overleaf.
This is how it looks like.
Next: colouring.
The code output is operational already.
You can put it in Overleaf.
This is how it looks like.
Next: colouring.

The diagram is excellent but even better with some colour.
I wanted to improve: fonts, arrows, height, contrast ratio.
I already knew I wanted to use the xcolor package.
And I had a colour scheme in mind.
I continued to prompt ChatGPT specifically with these instructions.
I wanted to improve: fonts, arrows, height, contrast ratio.
I already knew I wanted to use the xcolor package.
And I had a colour scheme in mind.
I continued to prompt ChatGPT specifically with these instructions.

Finally, I wanted to add a condition to the experiment (more boxes).
I also wanted to fix the colour names from generic to more specific.
All that was left was to iterate on the prompt (see image).
Then, I ended up with the figure from the beginning of the thread.
I also wanted to fix the colour names from generic to more specific.
All that was left was to iterate on the prompt (see image).
Then, I ended up with the figure from the beginning of the thread.

Hope this little ChatGPT trick was helpful for you.
1,245 smart academics read this before anyone else in my newsletter.
Join us here: view.flodesk.com/pages/6438556c…
1,245 smart academics read this before anyone else in my newsletter.
Join us here: view.flodesk.com/pages/6438556c…
If you got value from this: Are you going to retweet this thread?
https://twitter.com/16707495/status/1653072593581162499
• • •
Missing some Tweet in this thread? You can try to
force a refresh