In 2019 "Single-cell multimodal omics" was deemed @naturemethods Method of the Year, and since then many new multimodal methods have been published. But are there tradeoffs w/ multimodal omics?
tl;dr yes! An analysis w/ @sinabooeshaghi & Fan Gao in biorxiv.org/content/10.110… 🧵1/
tl;dr yes! An analysis w/ @sinabooeshaghi & Fan Gao in biorxiv.org/content/10.110… 🧵1/
There are a lot of ways to look at this question and we have much to say (long 🧵ahead!). As a starting point let's begin with our Supplementary Figure 4. This is a comparison of (#snRNAseq+#snATACseq) multimodal technology with unimodal technology. Much to explain here: 2/ 

(a) & (b) are showing the mean-variance relationship for data from an assay for measuring RNA and TAC (transposable accessible chromatin) in the same cells. The data is from ncbi.nlm.nih.gov/geo/query/acc.…
Cells from human HEK293T & mouse NIH3T3 were mixed. You're looking at the RNA. 3/
Cells from human HEK293T & mouse NIH3T3 were mixed. You're looking at the RNA. 3/
The mouse and human counts both display variance quadratic in the mean, consistent with negative binomial data. The quadratic coefficients are similar. This is also the case in (c) and (d) which are data from the same cell lines but with different technology called ISSAAC-seq. 4/
In (e) and (f) you see what unimodal data looks like. Same cell lines, but assayed with 10x Genomics #scRNAseq (the figures are reproduced from @const_ae and @wolfgangkhuber's recent preprint biorxiv.org/content/10.110…). Much less noise in unimodal data. 5/
Performing an analysis like this is difficult, because it requires apples-to-apples comparison. Currently, most multimodal assays are preprocessed with custom scripts or "pipelines" coupling together the equivalent of water pipes with electricity lines h/t @sinabooeshaghi . 6/ 

To perform like-to-like comparisons we had to develop new software that could be used on multiple different assays from different technologies. We focused for now on multimodal single-cell ATAC-seq + RNA-seq, and ended up building a program called snATAK on kallisto bustools. 7/ 

Now we could compare, say, ISSAAC-seq with SHARE-seq or SHARE-seqv2, or either of them to 10x Genomics Multiome. Or any of these assays to unimodal #scRNAseq or #snRNAseq or #snATACseq. We started by validating snATAK with the widely used Cell Ranger and Cell Ranger ARC tools. 8/
The first column is a comparison of snATAK to 10x's Cell Ranger ARC on 10x Multiome assayed PBMCs. The right column is a comparison of snATAK processing to Cell Ranger on a spatial ATAC-seq dataset (recently published by the @RongFan8 lab nature.com/articles/s4158…). 9/ 

With overall near identical results (although snATAK outperformed Cell Ranger on the spatial ATAC-seq data) we were ready to assess the multiome tradeoff, at least for ATAC-seq / RNA-seq (for now). BTW, snATAK is memory efficient, can run on @GoogleColab, and is fast. 10/ 

In a knee plot comparison of 10x ATAC-seq and the ATAC part of 10x Multiome you see that the multiome ATAC has an extra “knee” which is the result of a high load of cells resulting in doublets. In the relevant part, unimodal ATAC-seq outperforms its multiome counterpart. 11/ 

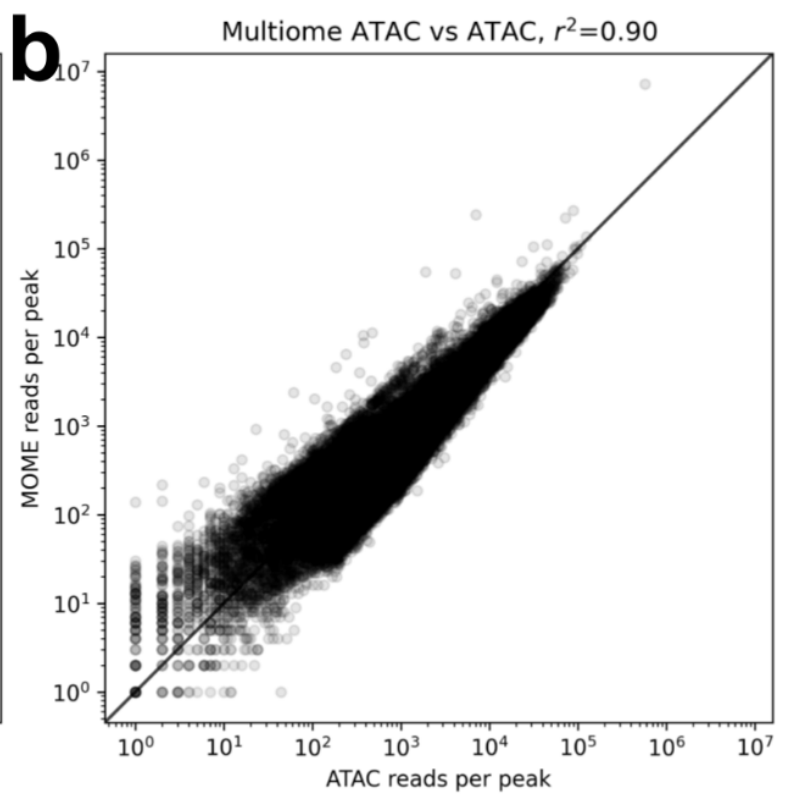
Multiome also suffers fewer reads per peak. Of course for these results datasets have been subsampled to the same depth. 12/ 

Back to the previous data, we performed comparisons of different technologies. There is a lot to unpack in the figure below. One technology has more doublets. But it also is much more efficient (at nuclei assayed / reads sequenced). Revealed thanks to uniform preprocessing. 13/ 

One of the useful features of snATAK is that it can perform allele-specific analysis. We used it to quantify the association between strand specificity in open chromatin, and strand specificity in expression. That's what you see here (w/ 10x Multiome PBMCs). 14/ 

In this plot each point is a cell type / SNP combination. The Alt / Ref on the x-axis is based on analysis of whether, in a cell type, the ATAC was open on the Ref or Alt strand only at a SNP. The y-axis is the corresponding Ref vs. Alt usage for gene expression. Makes sense. 15/
For this analysis the registration between RNA & ATAC is useful. We are sure that the same cells contribute both to the RNA and ATAC. However, while the result for cell types is convincing, we learn nothing about individual cells. The data is too sparse; a multiome tradeoff. 16/ 

In other words, here Multiome has produced a non-constructive existence proof. It's like asking for two numbers x and y such that x^y is rational, but x and y are both irrational. This is a seemingly hard problem. But... 17/
... we know that (√2^√2)^√2 = 2. Since √2 is irrational, if √2^√2 is rational we have an example. Otherwise one irrational number is √2^√2, and the other is √2, and we have an example. Existence proved. Not constructive. 18/
The code for reproducing the results described above, and for running snATAK, is here: github.com/pachterlab/BGP… 19/
There is much more to the multimodal tradeoff than is covered in our preprint: there are of course many other modalities to consider. But w/ snATAK (which can work whenever genome alignment is needed) & kallisto bustools we have shown that uniform preprocessing is possible. 20/20
Somehow the link to the @biorxivpreprint was scrambled in the first tweet. Reposting here, along with a link to the top of the thread. biorxiv.org/content/10.110…
https://twitter.com/lpachter/status/1653201162517229568?s=20
• • •
Missing some Tweet in this thread? You can try to
force a refresh


