Das Wichtigste was man über Klima-#Kipppunkte wissen sollte, in unter 13 Minuten: mein Eröffnungsvortrag der #Energietage von heute morgen.
Speziell zum Thema Atlantik-Umwälzzirkulation gibt es noch ein Kurzvideo von meinem Vortrag auf der Exeter-Konferenz zu Kipppunkten auf unserem Youtube-Kanal.
Lesenswert dazu alleine aus den letzten Monaten: 
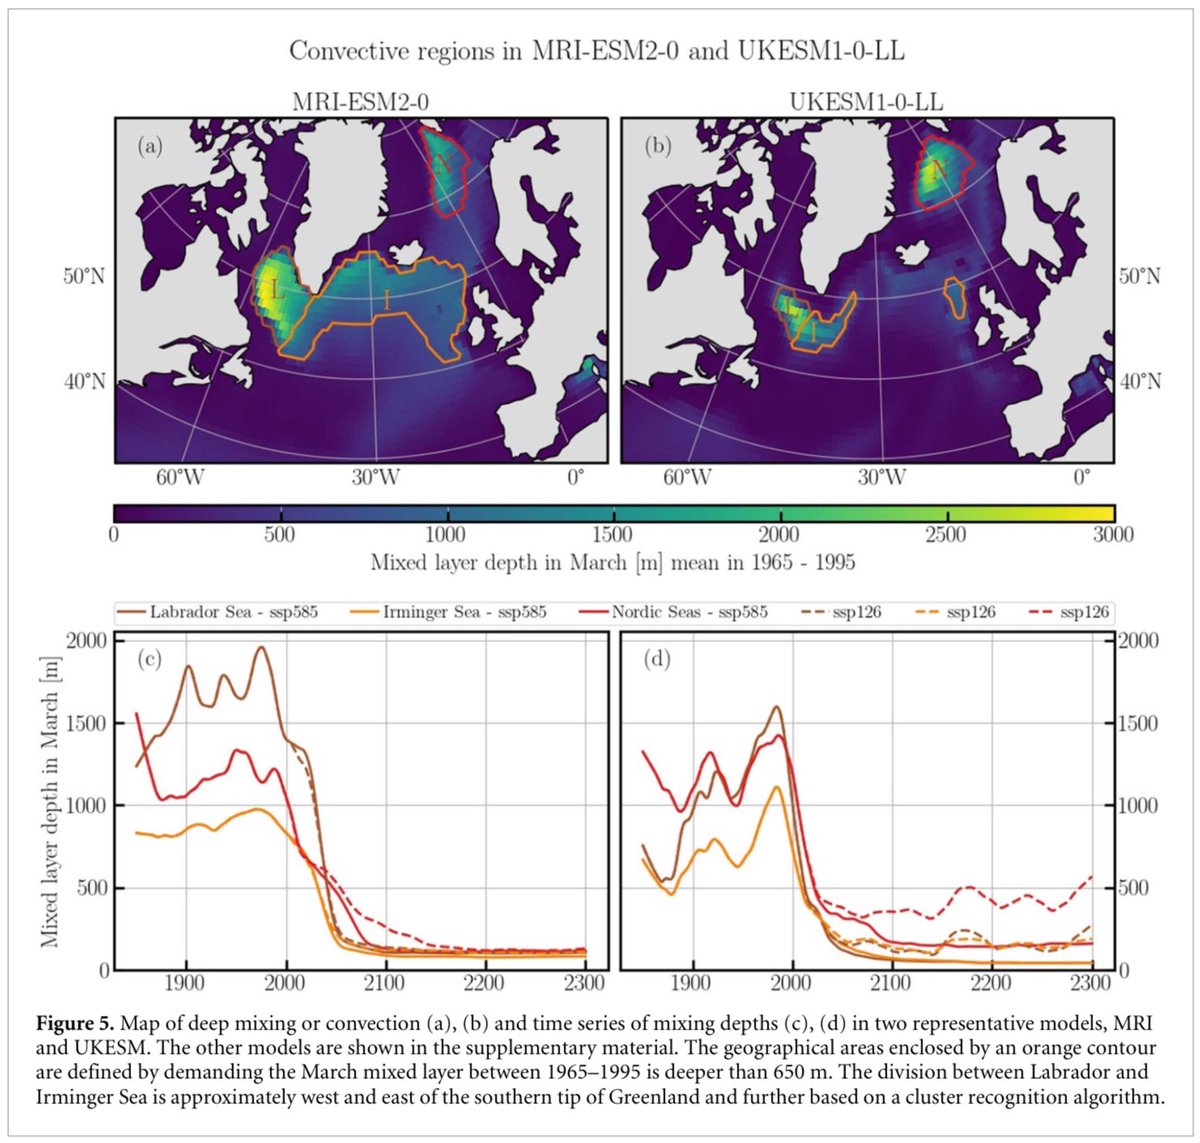
1. Übersichtsstudie aus Science vom September, science.org/doi/10.1126/sc…
(Unten eine deutsche Übersetzung der zentralen Grafik)
We see here a self-styled "honest broker" with decades of experience in downplaying climate change presenting an age-old climate denial trope: using *annual* rainfall data as argument against an increase in *extreme* rainfall.
Does he *really* not know better?
Brief 🧵1/4
What scientists have predicted since the 1980s is an increase in heavy rain at the expense of days with light or no precipitation. And that is indeed observed. See @Knutti_ETH That is because warmer air can hold more moisture (Clausius-Clapeyron law). 2/4 nature.com/articles/nclim…
That means an air mass saturated with water will hold 7% more water per degree of warming, so 7% more can rain out, all else remaining the same. Heavy rain gets that much stronger.
Why doesn't that apply to annual rainfall totals? Because those are ruled by different physics. 3/4
1. Extreme rainfall increases as global temperatures rise.
There’s a basic law of physics behind that (Clausius Claperon Law, known since 1834, see Wikipedia).
And numerous analyses of weather station data prove it. See e.g. ours. nature.com/articles/s4161…
2. Global warming is caused by fossil fuel emissions. That is why it was predicted correctly before it was even observed. And even by scientists from fossil fuel companies like Exxon Mobil. But their bosses decided to tell you a different story.
A new study by van Westen et al. shows that the #tippingpoint of the Atlantic overturning circulation #AMOC is also found in a high-resolution ocean model which resolves ocean eddies. A first, but no surprise to AMOC experts. 🧵
To find the tipping point you need to do a very slow, long hysteresis model run. That is so computationally expensive that it hasn't been tried before. All models which have tried show this tipping point - we published a first intercomparison in 2005. 🧵 agupubs.onlinelibrary.wiley.com/doi/10.1029/20…
So all kind of models since Stommel's 1961 box model show it, due to the destabilising salt transport feedback. The new model also shows the well-known sea surface temperature fingerprint pattern of an #AMOC shutdown: the 'cold blob', and warming along the American coast. 🧵
Zur Erinnerung: Kernfusion ist /keine/ Klimalösung sondern klimaschädlich. (Nur falls jemand auf die Idee kommt, diese Träume von Merz mit Klimaschutzgeldern zu subventionieren.)
Kurzer Thread in 5 Bildern.
2024 war global das heißeste Jahr seit Beginn der Aufzeichnungen, mit 1,6 Grad über dem Temperaturniveau des späten 19. Jahrhunderts. Kleiner Thread mit Datengrafiken dazu. 🧵
In Deutschland war es ebenfalls das wärmste Jahr seit Beginn der Aufzeichnungen - allerdings schon 3,1 Grad wärmer. Weil Deutschland ein Landgebiet ist, erwärmt es sich doppelt so schnell wie der globale Mittelwert, der 71% Meeresfläche enthält. 🧵
Diese moderne Erderwärmung ist praktisch komplett vom Menschen verursacht. Natürliche Faktoren haben weniger als + oder - 0,1 °C beigetragen. Das ist eine Kernaussage des Weltklimarats IPCC. Eher - als +, weil die Sonnenaktivität etwas abgenommen hat. 🧵
Important new study shows that current climate models underestimate the human-caused slowing of the #AMOC (Atlantic Meridional Overturning Circulation), because they neglect freshwater influx from Greenland melt and other sources. /1 nature.com/articles/s4156…
The study shows "that accounting for upper-end meltwater input in historical simulations significantly improves the data–model agreement on past changes in the Atlantic Meridional Overturning Circulation, yielding a slowdown of 0.46 sverdrups per decade since 1950." /2
In our 2018 Nature article (Caesar et al.) we estimated ~3 Sv slowing since 1950, i.e. -0.4 Sv/decade, based on the observed 'cold blob' in the Atlantic west of Britain. /3