1. A backgrounder on how soil moisture changes over time. A #NAFOWeather 🧵
https://twitter.com/davidhelms570/status/1650851710221295617?s=20
2. Soil moisture is one element of the water balance / hydrologic cycle which includes precipitation, terrain, vegetation state, and atmosphere (temperature, humidity, winds, sunshine/solar radiation). 

3. Rate of soil moisture changes over time:
Over Weeks to Months - Controlled by vegetation growth
Cite: Reference evapotranspiration in water requirement: Theory, concepts, and methods of estimation, Handbook of Hydroinformatics, 2023
sciencedirect.com/book/978012821…
Over Weeks to Months - Controlled by vegetation growth
Cite: Reference evapotranspiration in water requirement: Theory, concepts, and methods of estimation, Handbook of Hydroinformatics, 2023
sciencedirect.com/book/978012821…

4. Rate of soil moisture changes over time:
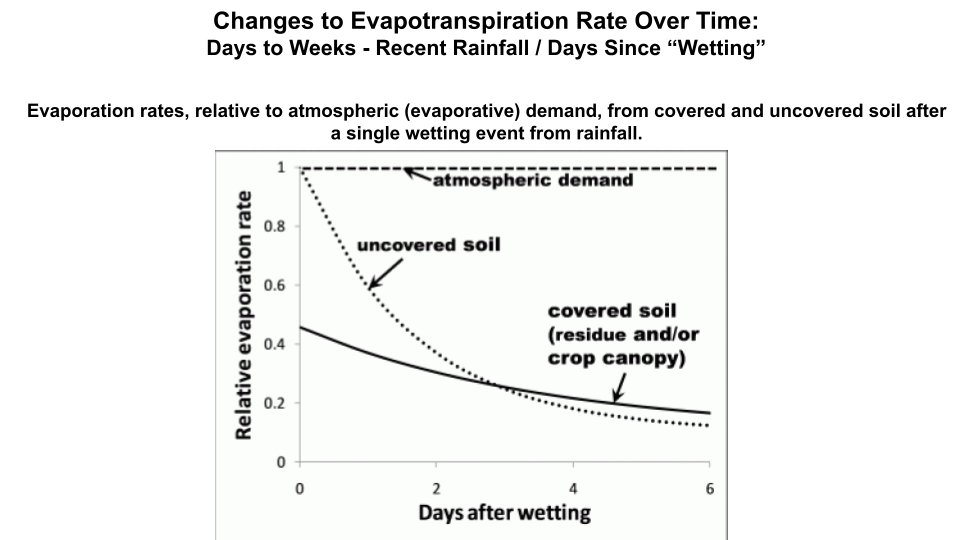
Over Days to Weeks - Controlled by recent rainfall / # Days Since "Wetting"
Reduce Need for Irrigation by Maintaining Crop Residue and Reducing Soil Tillage
water.unl.edu/article/agricu…
Over Days to Weeks - Controlled by recent rainfall / # Days Since "Wetting"
Reduce Need for Irrigation by Maintaining Crop Residue and Reducing Soil Tillage
water.unl.edu/article/agricu…

5. Rate of soil moisture changes over time:
Over Hours to Days: Controlled by atmospheric evaporative demand
What is Evaporative Demand?
cnap.ucsd.edu/wp-content/upl…
Over Hours to Days: Controlled by atmospheric evaporative demand
What is Evaporative Demand?
cnap.ucsd.edu/wp-content/upl…

6. Rate of soil moisture changes over time: Soil moisture is controlled by soil texture and % of organic material, sand dries rapidly, silt dries more slowly. Most of the soil type near the Line of Conflict is Silty Loam. 

7. This graphic is an example of a trafficability prediction for agriculture purposes. It is very likely overly optimistic for the "go" (green) trafficability for military applications, but useful to access factors impacting soil moisture.
Source: meteoblue.com/en/weather/agr…
Source: meteoblue.com/en/weather/agr…

8. These graphics are "meteograms" for agriculture for Chaplynka and Svatove. Meteograms are simply graphics of meteorological variables plotted in a time-series. These graphics are way too busy, so let's break the info down.
Source: meteoblue.com/en/weather/agr…
Source: meteoblue.com/en/weather/agr…

9. Lining up the agriculture trafficability forecast for Volnovakha, Donetsk, with the temperature, precipitation, humidity, Evapotranspiration (E), Evapotranspiration Demand and wind speed to get a snap-shot of variables impacting soil moisture. 

10. Previous tweet: Note the daily (diurnal) ramping down of soil moisture/improved trafficability during the daylight period (until 8 May when it rains!). This is a close-up of the same data for 5 May 2023 indicating factors controlling the amount of moisture loss. 

11. These graphics are forecast at points near the LoC. This graphic is a 2-D (planar) view of changes to soil moisture (volume %, surface to 10 cm) for the next 7 days. The forecast indicates rapid drying in the south but more modest drying in the east and north. 

12. Soil moisture doesn't tell the full story. Understanding necessary soil strength for the expected # of vehicles & vehicle ground pressure "foot print" must also be evaluated to assess mobility requirements for a specific "package" of vehicles. /end
https://twitter.com/davidhelms570/status/1640434216419598336?s=20
@threadreaderapp please unroll
• • •
Missing some Tweet in this thread? You can try to
force a refresh

 Read on Twitter


