Dr Clare Craig Profile picture
May 15, 2023 11 tweets 4 min read Read on X
Maternal deaths from cardiac causes have been reclassified as covid deaths.

It was evident from 2020 and this year's data confirms this.

🧵 Image
Here's the reclassification from the previous report up to 2018-2020.

This table has been omitted from the current report but can mostly be deduced based on the graph of rates.

npeu.ox.ac.uk/assets/downloa… Image
Here's a graph where cardiac and covid deaths are included in the same death rate (per 100,000 maternities).

The rate dropped markedly in 2018-2020 and was slightly higher from 2019-2021 but was comparable to 2014-2016. Image
In the meantime there was a massive rise in suicides of pregnant women which appears to be a 2020 phenomenon and a rise in thrombosis deaths.

There was also a rise in deaths from (pre)eclampsia and pregnancy related sepsis. Image
Looking at the period 2018-2021 and comparing to 2014-2017 we see the following excess maternal deaths. Cardiac and covid were grouped for this analysis.

These look more like policy induced deaths than covid deaths to me.

Access to healthcare saves lives. Image
If I was as pro-vax as possible then you could claim that the 2019-2021 saw 6 more deaths from cardiac and covid combined than the 2014-2017 average.
If we assume
a) they were all due to covid
b) they were all in the unvaccinated
c) that someone had invented a miraculous Vx that could have prevented all of those deaths
then vaccinating 2,066,997 mums in that period would have given an absolute risk reduction for the miracle of 0.0000029%

or 1 life saved per 340,000
N.B. There is no data by year which makes interpretation slightly challenging.

There is also no indication of how many women had more than one cause of death included in the data.

npeu.ox.ac.uk/mbrrace-uk/dat…
Someone has pointed out that the figures for cardiac deaths look like a repetition of the row above.
I do not know if there was an error in this report. @NPEU_UKOSS will know.

I have recalculated based on subtracting other causes from total.
Still big misclassification of cardiac death in 2018-2020.

With this corrected data, including all cardiac and covid deaths together, there was an excess of 31 deaths = 0.000015% of maternities. Image

• • •

Missing some Tweet in this thread? You can try to force a refresh
 

Keep Current with Dr Clare Craig

Dr Clare Craig Profile picture

Stay in touch and get notified when new unrolls are available from this author!

Read all threads

This Thread may be Removed Anytime!

PDF

Twitter may remove this content at anytime! Save it as PDF for later use!

Try unrolling a thread yourself!

how to unroll video
  1. Follow @ThreadReaderApp to mention us!

  2. From a Twitter thread mention us with a keyword "unroll"
@threadreaderapp unroll

Practice here first or read more on our help page!

More from @ClareCraigPath

Aug 27
🚨USA - your babies are dying.

This is a professional deep dive into the official data.

It explains the alarming numbers of deaths of under 1 year olds.

It’s time the authorities took notice and they won’t unless you make them.

These babies did NOT need to die 🚨
The green dots show the annual mortality rate for babies under 1 year old in USA each year.

These are too high in the last three years ('21-'23).

People draw different baselines to claim these deaths can be ignored but I will show you why they cannot be. Image
Data from '24 and '25 are incomplete but we can take a closer look at when the deaths increased.

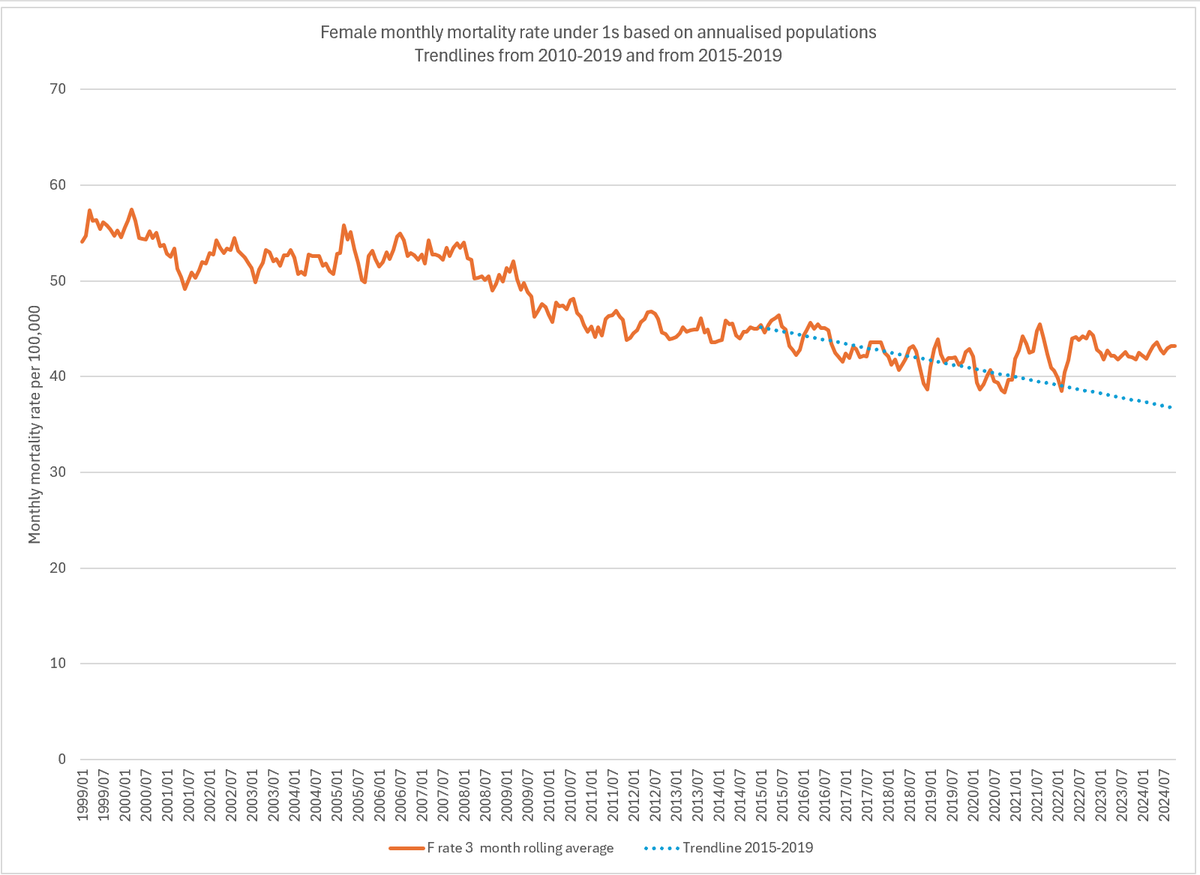
Here are deaths in US baby girls.

Nothing happens from March '20 to March '21. From April '21 the babies start dying.

There is a winter reprieve in '21-'22 then it returns. Image
Read 14 tweets
Aug 26
USA - your babies are dying.

I have taken a deep dive to understand exactly what's happening with deaths of under 1 year olds.

Who wants to look at baby deaths?
I get it.
But DO NOT LOOK AWAY.
It is....
First of all I did this because of frustration with people arguing over what "expected" deaths should look like.

You can make up reasons for picking particular years and come up with a totally different story.

'99-'19 excess deaths from '21
'11-'16 deficit in deaths from '21 Image
What can we do to see if the rise is meaningful?

First we can look monthly ('24 and '25 data is incomplete)

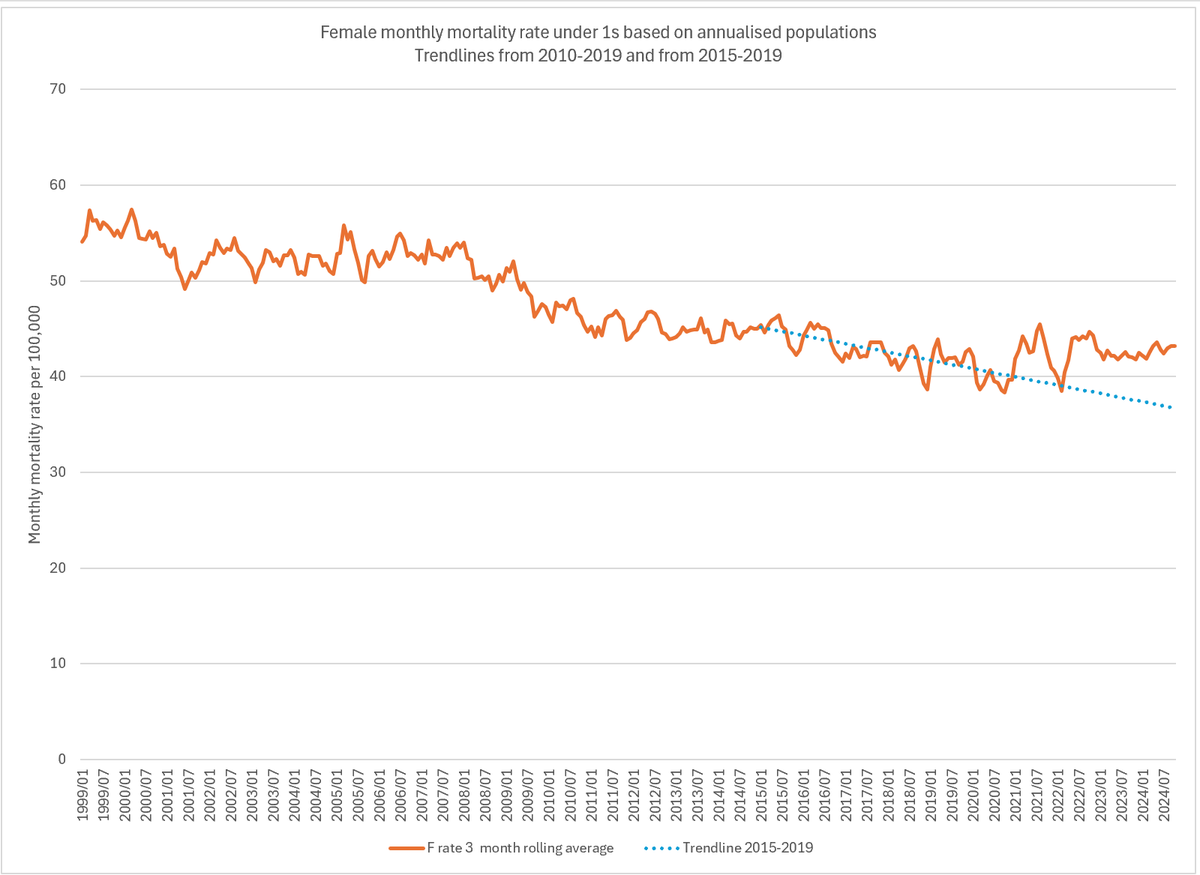
Here are the monthly deaths for females which rises from March 2021 (having been below expected before) and stays high except for deficit in winter 2021-2022. Image
Read 13 tweets
Jun 6
The overall excess mortality has reduced to almost zero but this hides too many deaths in the young.

Thread of excess mortality in England based on gov estimates of population and death rate trends from 2014-2019.

0-24 year olds. Image
25-49 year olds Image
Read 8 tweets
Mar 20
One of the most important stories of lockdown has rarely been shared.

It is the story of Seattle.

They broke ranks and started an important experiment. 🧵
One research laboratory decided to break the rules for the sake of public health.

Rather than wait for a CDC approved covid test, they adapted an existing influenza test and started testing.

yahoo.com/news/seattle-l…
The regulator was not impressed.

This was a research laboratory doing clinical diagnostic testing and that was not allowed.

The lab was shut down on 9th March 2020.

nytimes.com/2020/03/10/us/…
Read 9 tweets
Feb 9
Remember the Beta variant in South Africa?

Remember how AstraZeneca said their vaccine was only 10% effective against it?

They blamed the variant but it has nothing to do with that...🧵

bbc.co.uk/news/world-afr…
All the vaccines ever did was make people immune suppressed for two weeks.

The consequence was that those who were susceptible to a particular variant had their infections earlier than they would have.

You can measure after that point and get an illusion of benefit.
This trick only works if you vaccinate during a wave.

For the UK - we were fast getting to those most susceptible to dying. Our death wave looks like a witch's hat on top of Europe's because of the earlier infections.

N.B. the impact was felt by the unvaccinated too. Image
Read 6 tweets
Jan 17
How do we how well the covid vaccines performed?

We can look at this question from multiple angles and see. 🧵
First, there was the "secondary attack rate".

When someone tested positive this measure could be taken of the percentage of household contacts that later tested positive.

If vaccines reduced risk of infection this should have fallen.

It did not. Image
Another measure is how many people developed antibodies before and after vaccine. Image
Read 15 tweets

Did Thread Reader help you today?

Support us! We are indie developers!


This site is made by just two indie developers on a laptop doing marketing, support and development! Read more about the story.

Become a Premium Member ($3/month or $30/year) and get exclusive features!

Become Premium

Don't want to be a Premium member but still want to support us?

Make a small donation by buying us coffee ($5) or help with server cost ($10)

Donate via Paypal

Or Donate anonymously using crypto!

Ethereum

0xfe58350B80634f60Fa6Dc149a72b4DFbc17D341E copy

Bitcoin

3ATGMxNzCUFzxpMCHL5sWSt4DVtS8UqXpi copy

Thank you for your support!

Follow Us!

:(