Maternal deaths from cardiac causes have been reclassified as covid deaths.

It was evident from 2020 and this year's data confirms this.

🧵 Image
Here's the reclassification from the previous report up to 2018-2020.

This table has been omitted from the current report but can mostly be deduced based on the graph of rates.

npeu.ox.ac.uk/assets/downloa… Image
Here's a graph where cardiac and covid deaths are included in the same death rate (per 100,000 maternities).

The rate dropped markedly in 2018-2020 and was slightly higher from 2019-2021 but was comparable to 2014-2016. Image
In the meantime there was a massive rise in suicides of pregnant women which appears to be a 2020 phenomenon and a rise in thrombosis deaths.

There was also a rise in deaths from (pre)eclampsia and pregnancy related sepsis. Image
Looking at the period 2018-2021 and comparing to 2014-2017 we see the following excess maternal deaths. Cardiac and covid were grouped for this analysis.

These look more like policy induced deaths than covid deaths to me.

Access to healthcare saves lives. Image
If I was as pro-vax as possible then you could claim that the 2019-2021 saw 6 more deaths from cardiac and covid combined than the 2014-2017 average.
If we assume
a) they were all due to covid
b) they were all in the unvaccinated
c) that someone had invented a miraculous Vx that could have prevented all of those deaths
then vaccinating 2,066,997 mums in that period would have given an absolute risk reduction for the miracle of 0.0000029%

or 1 life saved per 340,000
N.B. There is no data by year which makes interpretation slightly challenging.

There is also no indication of how many women had more than one cause of death included in the data.

npeu.ox.ac.uk/mbrrace-uk/dat…
Someone has pointed out that the figures for cardiac deaths look like a repetition of the row above.
I do not know if there was an error in this report. @NPEU_UKOSS will know.

I have recalculated based on subtracting other causes from total.
Still big misclassification of cardiac death in 2018-2020.

With this corrected data, including all cardiac and covid deaths together, there was an excess of 31 deaths = 0.000015% of maternities. Image

• • •

Missing some Tweet in this thread? You can try to force a refresh
 

Keep Current with Dr Clare Craig (not one of her impersonators)

Dr Clare Craig (not one of her impersonators) Profile picture

Stay in touch and get notified when new unrolls are available from this author!

Read all threads

This Thread may be Removed Anytime!

PDF

Twitter may remove this content at anytime! Save it as PDF for later use!

Try unrolling a thread yourself!

how to unroll video
  1. Follow @ThreadReaderApp to mention us!

  2. From a Twitter thread mention us with a keyword "unroll"
@threadreaderapp unroll

Practice here first or read more on our help page!

More from @ClareCraigPath

May 11
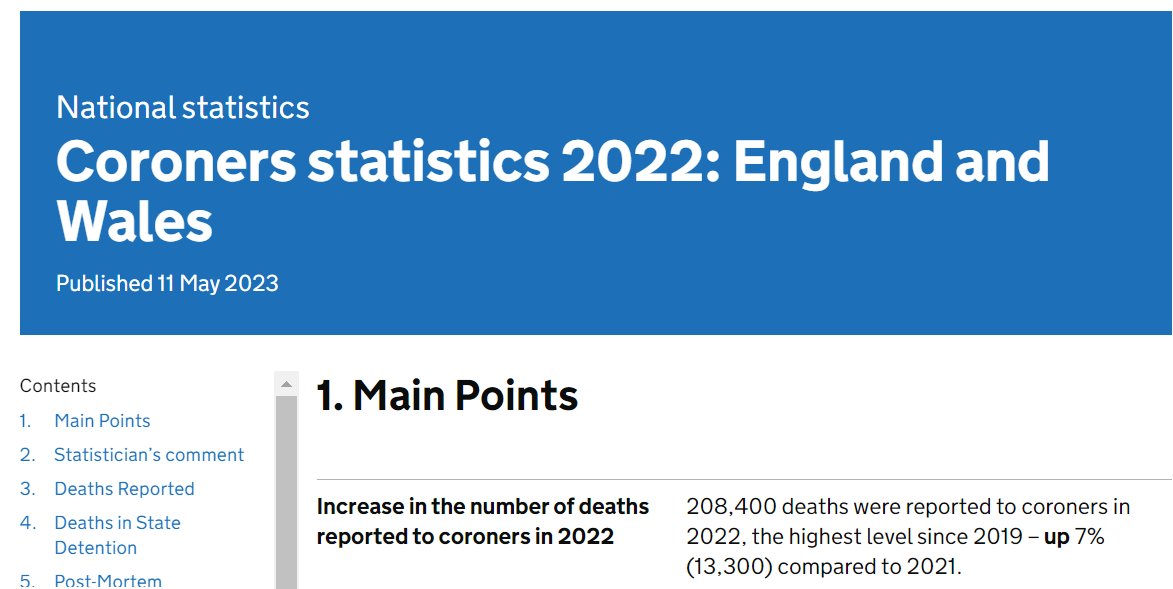
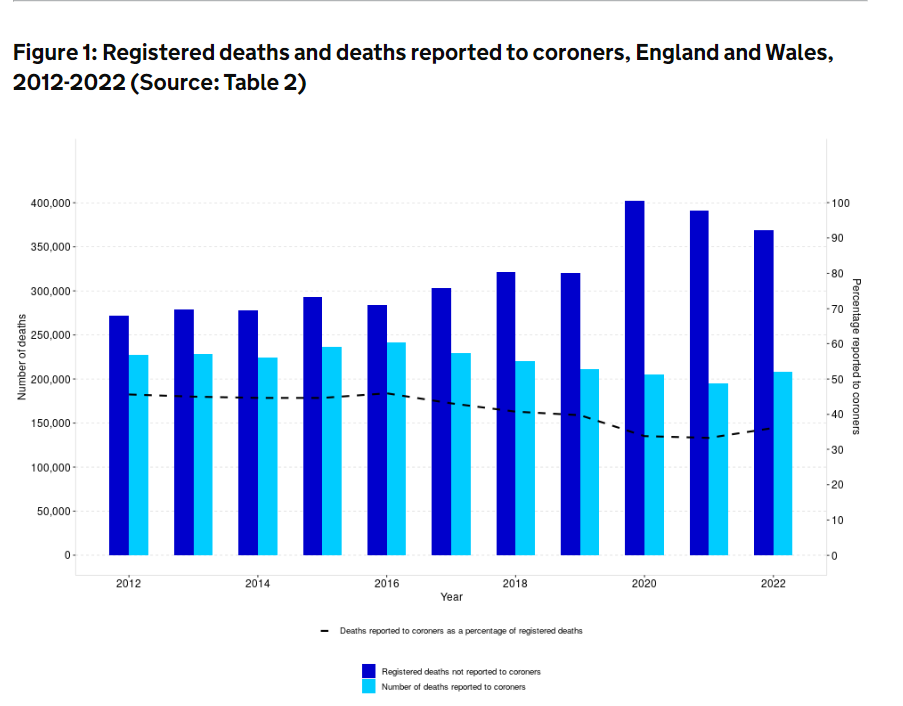
13,300 extra deaths reported to the coroner in 2021 than 2022. A 7% rise.
gov.uk/government/sta…. Image
The rise in deaths in 2020 and 2021 did not see a comparable rise in referrals for investigation as to the cause of death. Image
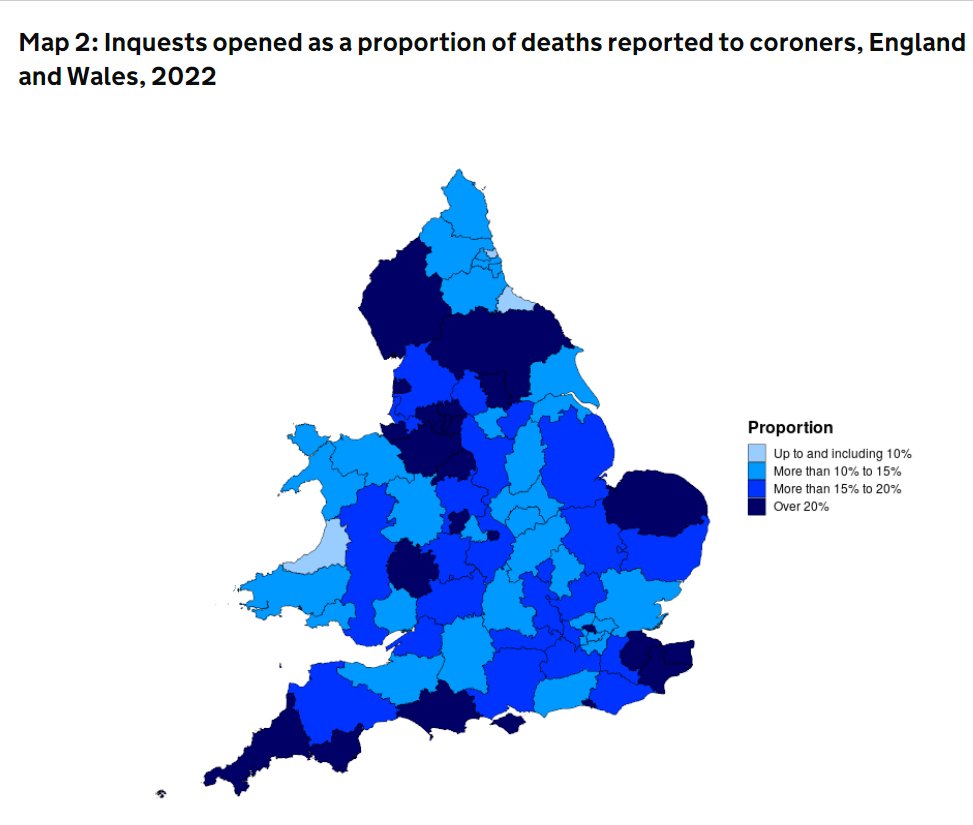
There was an 11% rise in deaths going to inquest. Image
Read 10 tweets
May 10
He is so full of contradictions:

The PANDEMIC is over but the virus is here to stay.

The EMERGENCY is over but you must stay on your guard.

It's an abuse of language. 🧵
The definition of a 'pandemic' used to mean a global infectious disease that threatened enormous numbers of deaths including in the young.

The WHO changed that definition in 2009 before the "swine flu pandemic".

archive.hshsl.umaryland.edu/bitstream/hand…
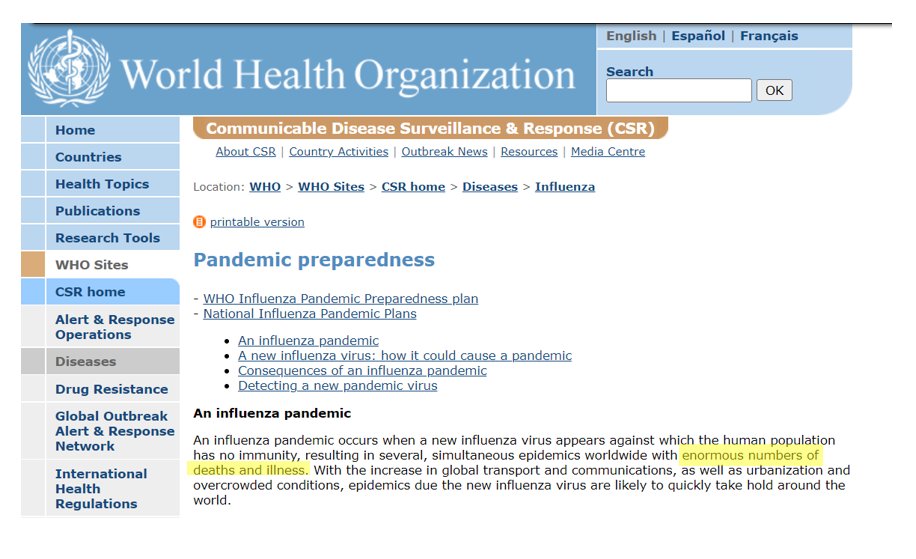
Prior to that time their website had said a pandemic would bring "enormous numbers of deaths and illness."

web.archive.org/web/2003020214… Image
Read 15 tweets
May 8
I have been very busy recently preparing a witness statement for the covid Public Inquiry.

They asked me to share details of deaths in 15-19 year olds males associated with 💉rollout so I had to explain the bigger picture regarding concerns with these 💉.

I said this: 🧵 Image
Feb 2020 Whitty said
“The rate limiting steps are late clinical trials for safety & efficacy, & then manufacturing. For a disease with a low (for the sake of argument 1%) mortality...

telegraph.co.uk/news/2023/03/0…
...a vaccine has to be very safe so the safety studies can’t be shortcut. So important for the long run.”

The belief that vaccines were safe had led to a circular belief that vaccines required fewer safety checks than other novel therapies.
Read 35 tweets
Apr 22
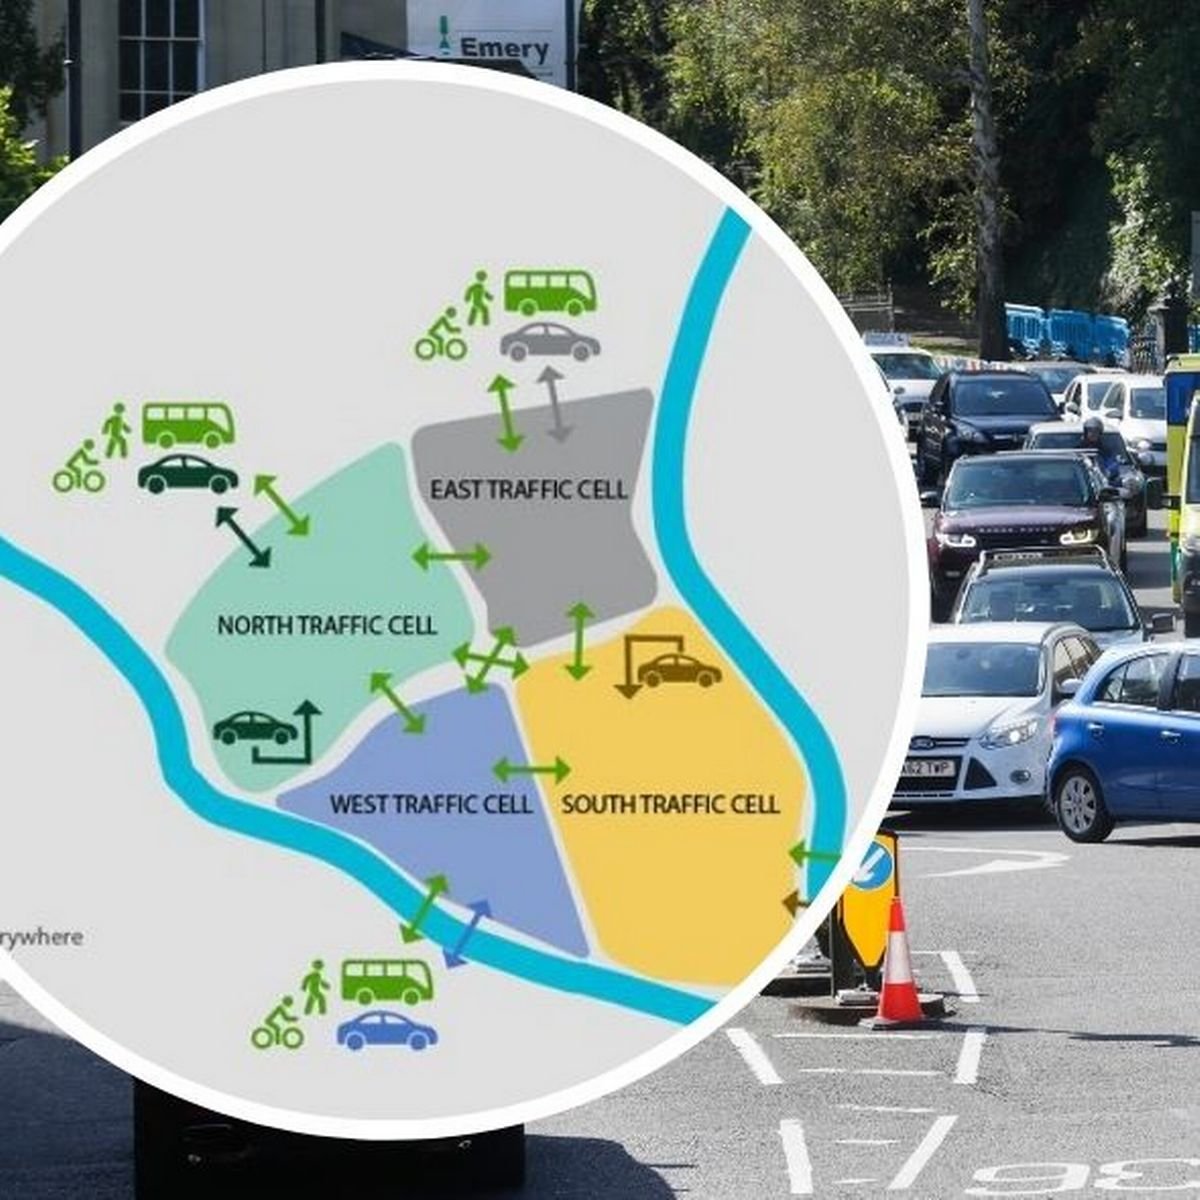
15 min city concept is sold as being about giving people more so they need to travel less.

Reality so far is it just stops cars.

If you are on the edge of a "zone" / "cell" then you can only drive one way.

Why are they being introduced in synch globally?🧵 Image
The first ones, like Utrecht were focused on improving lives but this cannot be said for more recent ones which appear to solely focus on road blocks.

weforum.org/agenda/2022/12…
Here's a good introduction:
Read 18 tweets
Apr 12
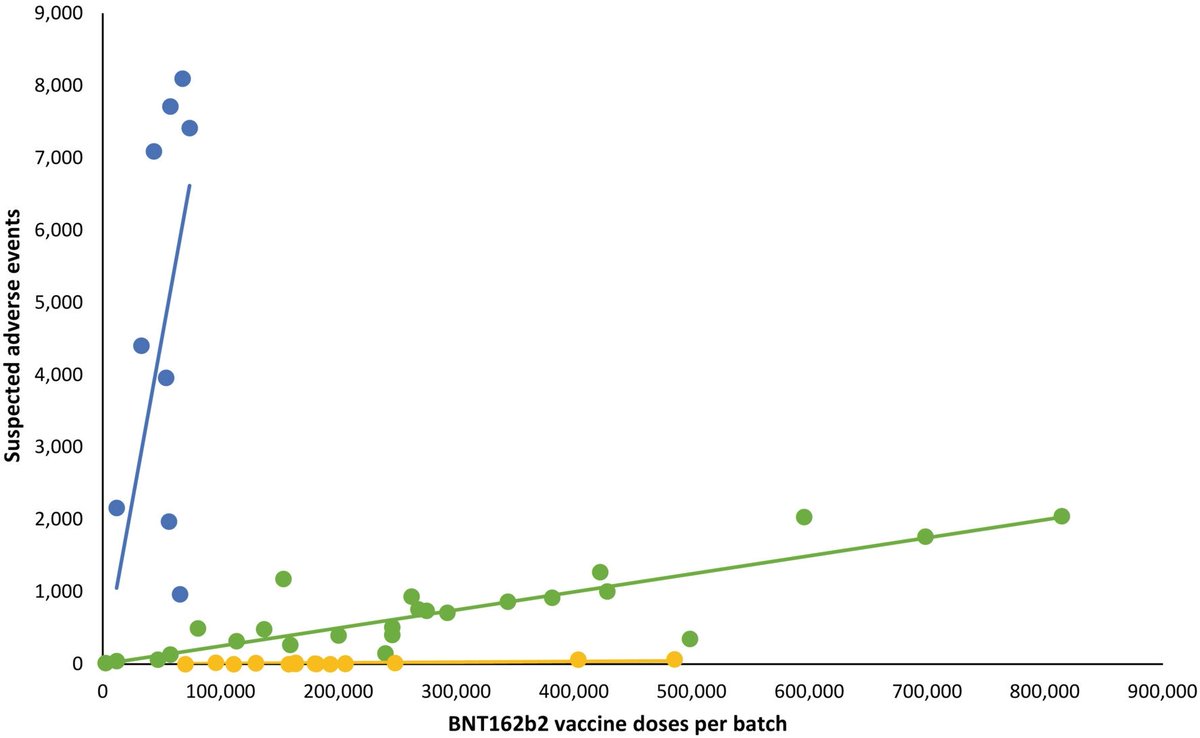
Danish study on adverse events by batch.

Low, medium and high rates of adverse reactions.

Why the difference?

🧵 Image
First, let's see if it could all be explained if the products were totally safe.

If all batches were identical and safe then reports would only be of coincidences and would depend on how sick recipients were.
Early batches given to the most frail and health and care workers may have had fewest reports.

Illness in the most frail would be likely to be attributed to their frailty.

Health and care workers are well and unlikely to have a coincidence.
Read 8 tweets
Mar 27
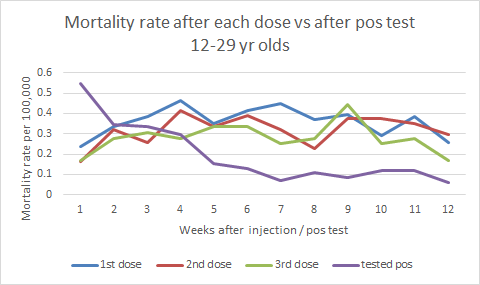
The ONS have released new data on deaths after vaccination and a positive pre-Omicron test result in 12-29 year olds.

This is the key graph showing mortality in the first 12 weeks.

(~60% of this age group tested positive in this period) 🧵
Note that more than 7 weeks after a positive pre-Omicron test result the mortality settles to a rate of 0.1 per 100,000.

That seems like a reasonable baseline estimate. So why is the mortality rate higher after injection?
The ONS say this is because those at highest risk of an expected death were most likely to be vaccinated.

How can we account for that?

We can assume that those who were at highest risk went on to have a third dose and use that rate to estimate any increase after dose 1 or 2.
Read 12 tweets

Did Thread Reader help you today?

Support us! We are indie developers!


This site is made by just two indie developers on a laptop doing marketing, support and development! Read more about the story.

Become a Premium Member ($3/month or $30/year) and get exclusive features!

Become Premium

Don't want to be a Premium member but still want to support us?

Make a small donation by buying us coffee ($5) or help with server cost ($10)

Donate via Paypal

Or Donate anonymously using crypto!

Ethereum

0xfe58350B80634f60Fa6Dc149a72b4DFbc17D341E copy

Bitcoin

3ATGMxNzCUFzxpMCHL5sWSt4DVtS8UqXpi copy

Thank you for your support!

Follow Us on Twitter!

:(