Nick Gerli Profile picture
May 22, 2023 8 tweets 3 min read Read on X
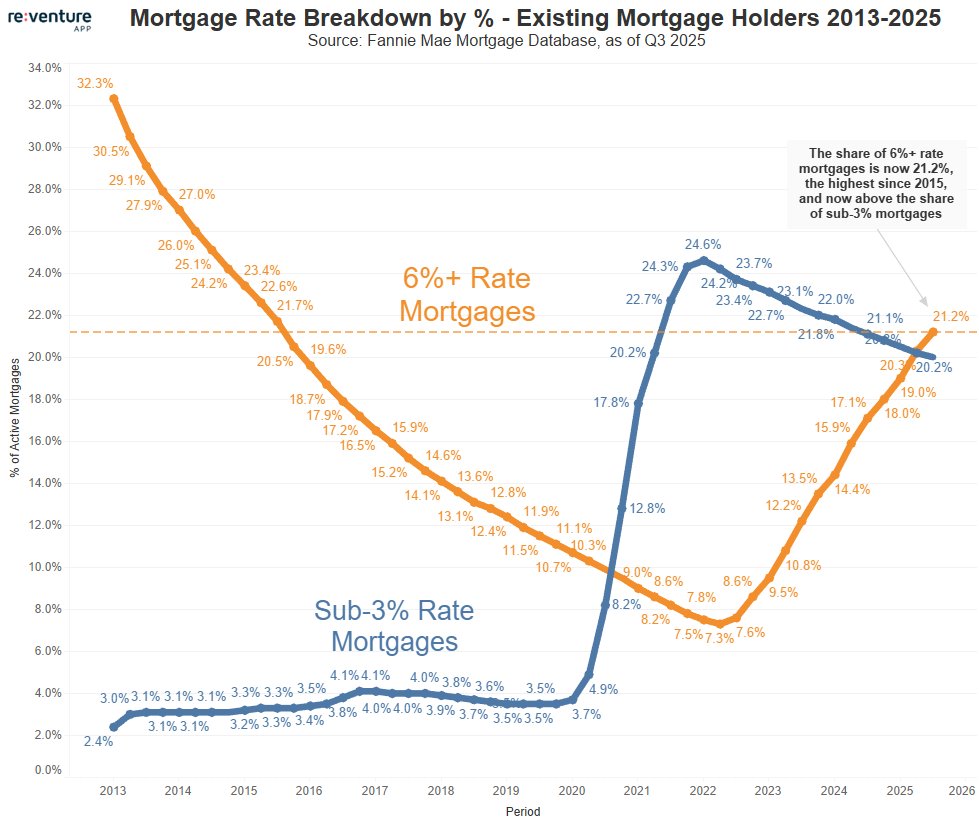
Mortgage rates back to 7%.

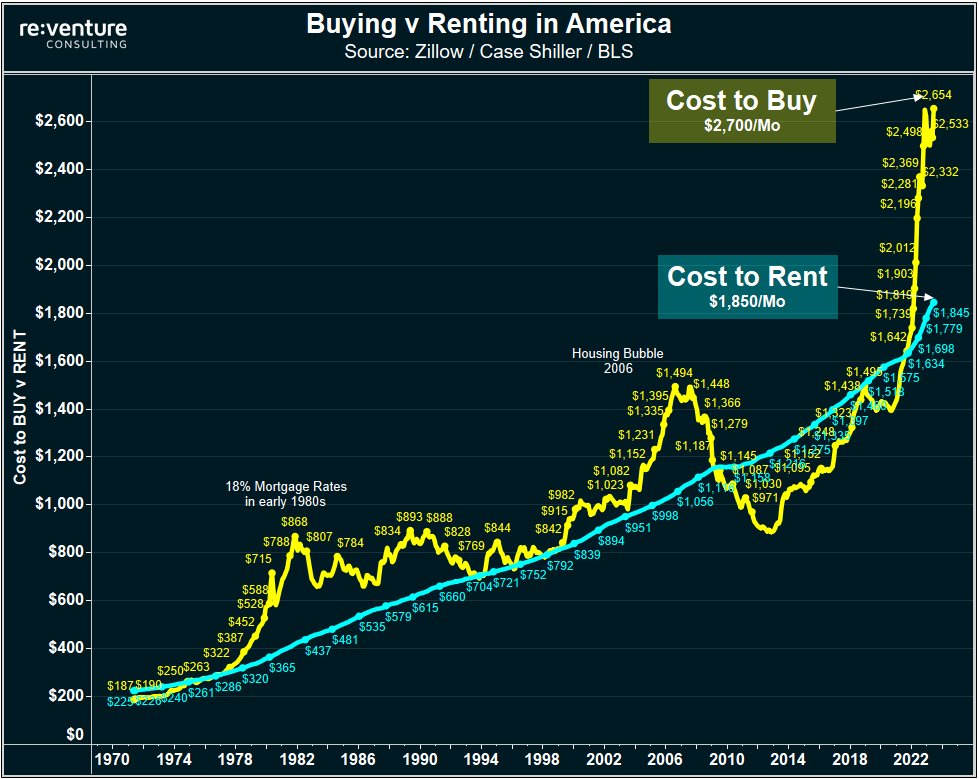
Meaning that the cost to buy a house in America is now approaching $2,700/month when including mortgage, tax, insurance, and maintenance.

Meanwhile, cost to rent is $1,850.

Biggest gap we've ever seen. Something has to break. Image
1) the easiest thing to "break" is Mortgage Rates going back down.

The next easiest thing to break is Home Prices coming down.

Likely some combination of the two will be required to save the US Housing Market from another massive collapse in buyer demand.
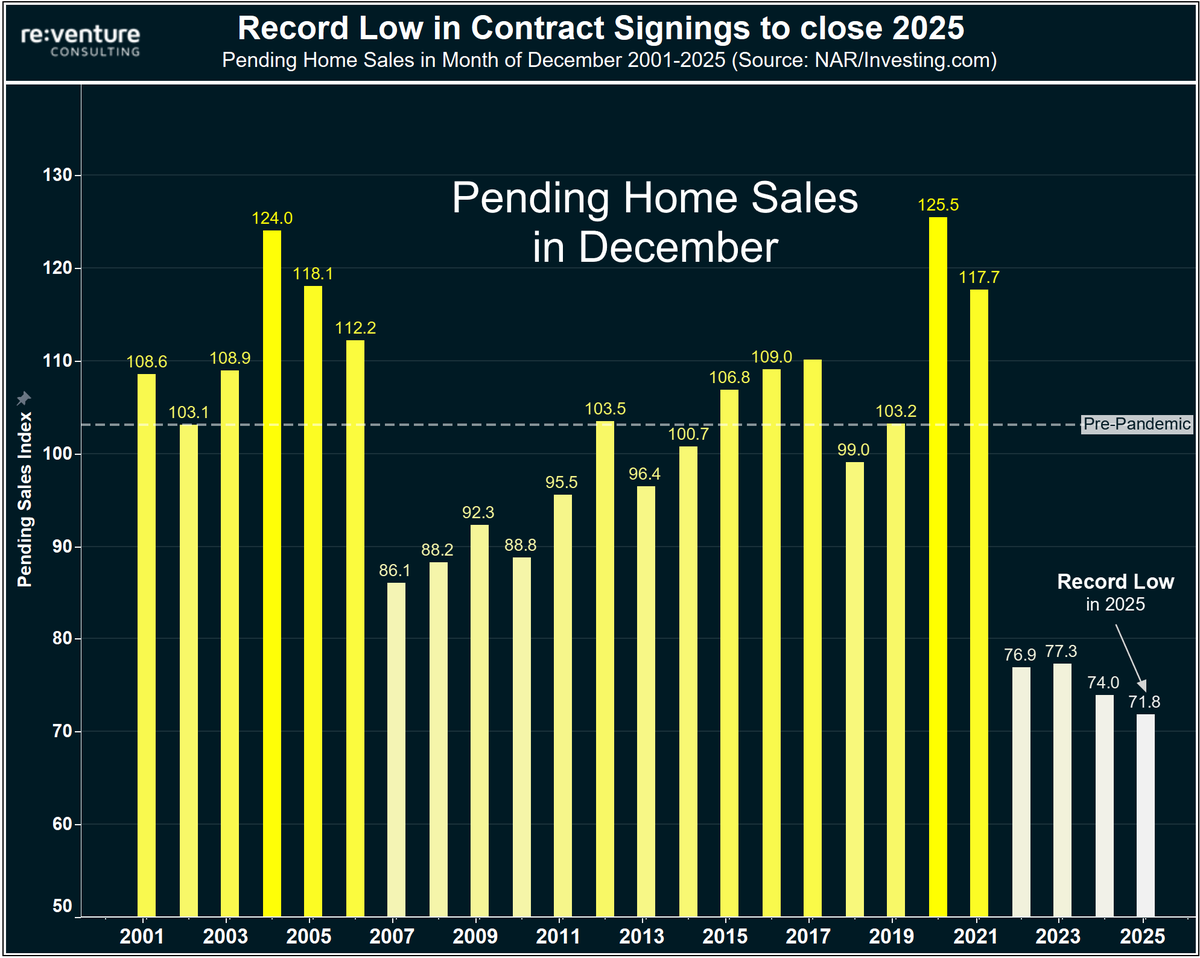
2) Mortgage applications to buy a house in mid-May were already at lowest level in 20 years.

Now they will likely decline further due higher mortgage rates.

I mean - how low can homebuyer demand in the US Housing Market go before something in the economy breaks? Image
3) In the end I don't think 7% mortgage rates will stay for long.

Because the housing market can't handle it. Transaction volume is already far too low.

If it goes down further, layoffs in associated industries like construction, manufacturing & retail will follow.
4) The banking system might also have problems.

The last time mortgage rates hit 7% in early March, Silicon Valley Bank happened.

(There's still lots of unrealized losses on the books for banks, so these spikes in rates are very destabilizing to the banking system) Image
5) The US consumer will also have problems.

Higher rates means not only will mortgages be more expensive, but so will credit cards and car loans.

Occurring just as wage growth is stagnating. And even going negative for higher income groups.

(Source: Bank of America) Image
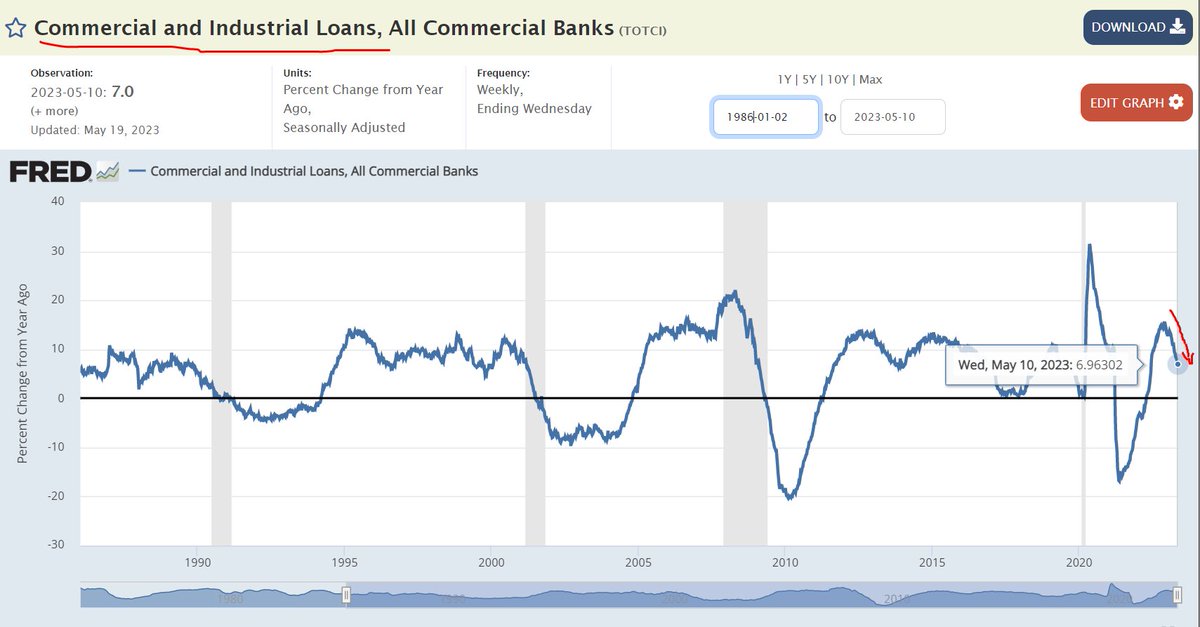
6) Rates are also going up just as bank lending is declining.

Take a look at Commercial & Industrial loan growth (loans to businesses).

Down from 15% to 7% growth YoY. And will likely keep falling.

Historically a big recession signal. Image
7) So yeah - hard to see how see higher rates don't break the economy and housing market.

And eventually result in lower rates.

Check out the blog post I wrote on the Reventure App website for more analysis. Free to read and subscribe!

reventure.app/blog/mortgage-…

• • •

Missing some Tweet in this thread? You can try to force a refresh
 

Keep Current with Nick Gerli

Nick Gerli Profile picture

Stay in touch and get notified when new unrolls are available from this author!

Read all threads

This Thread may be Removed Anytime!

PDF

Twitter may remove this content at anytime! Save it as PDF for later use!

Try unrolling a thread yourself!

how to unroll video
  1. Follow @ThreadReaderApp to mention us!

  2. From a Twitter thread mention us with a keyword "unroll"
@threadreaderapp unroll

Practice here first or read more on our help page!

More from @nickgerli1

Jun 13
The cost of buying a house with a mortgage has exploded.

Back in 1955, it cost $112/month to take out a mortgage to buy a house.

In 2025, it costs $2,800/month. That's an astounding 2,300% increase over 70 years.

In the last five years alone, mortgage costs have nearly doubled.

These costs have surged faster than people's incomes, creating a massive housing affordability crisis.

The question is: what happens next?

Following the 2000s housing bubble, there was a crash, and mortgage costs dropped 40% in half a decade.

But following the 1970s housing inflation, there was no crash. Instead, home-buying costs stabilized for two decades, allowing incomes to catch up.

I see similarities in 2025 to both previous eras, as we are in a massive home price bubble today (similar to the mid-2000s) and have also experienced rampant inflation over the last several years (similar to the 1970s).

The net result is that no one can afford homes right now. And the only cure for this is a combination of cheaper prices, lower mortgage rates, and higher incomes.

And it might take years to get there.Image
1) One thing is for sure: the current trajectory of housing costs is not sustainable.

Homebuyers are priced out of the market, and demand has collapsed as a result.

Many people in real estate keep tricking themselves into thinking a rebound is around the corner.

But there will be no rebound so long as prices remain high.
2) One metric that is especially shocking is comparing the growth in mortgage costs in the 2020s to previous decades.

Thus far, through a little over five years, the cost of buying a house with a mortgage has surged 89%.

That's a 16.3% per year growth rate. Image
Read 13 tweets
Jun 5
The U.S. housing market just broke 1,000,000 listings.

Excess inventory is piling up.

Relative to buyer demand, we now have the highest inventory in close to a decade.

Which is causing home prices to drop in over half the U.S. Image
1) This was the highest active listing count for May since 2019, according to data.

This is important because it signals that sellers are now facing stiff competition to sell their homes.

A marked reversal from the pandemic boom, and a signal that gains in affordability are coming for buyers.Realtor.com
2) Sellers are now also getting more eager to cut the prices on these listings, with the price cut rate surging up to 24.6% of total listings in May 2025.

That's the highest level of price reductions for the month of May on record, going back to 2017. Image
Read 9 tweets
Jun 3
Home values declined in over 60% of US counties in April 2025.

The only other two times we saw this breadth of home value declines was the 2008 crash and the 2022 mortgage rate spike.

More than half the country is now officially in MoM declines. Indicating that the housing downturn is spreading.

We'll have to see if this lasts into the future, and if it turns into a sustained correction like 2008 or is a blip like 2022. But given the trajectory of listings and inventory, it seems like more value declines are coming.Image
1) We have to be careful not to overanalyze one month of data. However, to see 60%+ of US counties recording a decline on Zillow's home value index suggests something big could be happening.
2) The last time this happened it was a bit of a head fake, in 2022, when 77% of counties experienced a decline in September 2022.

This was right after the Fed raised interest rates, and there was a short-term dislocation in the market where sellers panicked and cut prices. Because they feared an economic recession was imminent.

That recession didn't happen, and prices bounced back.
Read 5 tweets
May 30
Florida investor bought for $550k in 2022.

Just sold it for $391k.

28% loss in 3 years.

Market turning down fast. Image
1) What's interesting about this house is that the investor, a Blackstone-owned entity, purchased it for $550k in April 2022.

And then turned around and tried to sell it two years later. Listing for $529k in April 2024.

The house sat on the market for a year, and they incrementally lowered the price until finally it sold.
2) This does not appear to be a Hurricane-damaged property, as they had already cut the price down to $431k (22% loss from purchase) before the hurricanes hit.

After the hurricane hit, the price went down another $40k (7%). Image
Read 10 tweets
May 27
We have the biggest gap ever between Home Prices and Mortgage Rates in 2025.

Prices are 90% above the 130-year average.

Meanwhile, Mortgage Rates are right around the long-term average (6.7%).

The resulting gap makes one thing clear: home prices are too high and need to come down.Image
1) Particularly telling is how this Home Price bubble, in inflation-adjusted terms, is even bigger than the one in 2006.

Homebuyers intuitively know this, which is why they have stopped buying homes.
2) Mortgage rates are not what's deterring buyers from purchasing homes right now.

While rates seem high compared to where they were in the pandemic, they're not high compared to long-term norms.
Read 14 tweets
May 26
The U.S. is in the midst of a severe demographic collapse.

Births are plummeting, deaths are rising, and our organic population growth is down 72% over the last 15 years.

Back in 2008, the U.S. Experienced:

4.31 million births 👶
2.44 million deaths 💀
1.87 million organic growth

Fast forward to 2024, and the figures are:

3.61 million births
3.09 million deaths
520,000 organic growth

That 520,000 organic growth figure is a mere 0.15% of the U.S. population, meaning we basically have no more growth from natural means (Births-Deaths).

Not good for the housing market or the economy, and a serious issue that needs more attention.Image
1) Here's a potentially better way to visualize this: the natural increase in the population as a % of total population.

In 2024, the natural increase fell to only 0.15% growth.

Back in 2008, it was at 0.62% growth. Image
2) The basic idea here is that the U.S. isn't growing anymore internally. The population has aged to a point where deaths are surging (+25% since 2008), while the same aging has reduced the number of births (-16%).

Some younger people also put off forming families, further constraining the birth rate.
Read 14 tweets

Did Thread Reader help you today?

Support us! We are indie developers!


This site is made by just two indie developers on a laptop doing marketing, support and development! Read more about the story.

Become a Premium Member ($3/month or $30/year) and get exclusive features!

Become Premium

Don't want to be a Premium member but still want to support us?

Make a small donation by buying us coffee ($5) or help with server cost ($10)

Donate via Paypal

Or Donate anonymously using crypto!

Ethereum

0xfe58350B80634f60Fa6Dc149a72b4DFbc17D341E copy

Bitcoin

3ATGMxNzCUFzxpMCHL5sWSt4DVtS8UqXpi copy

Thank you for your support!

Follow Us!

:(