1/ 
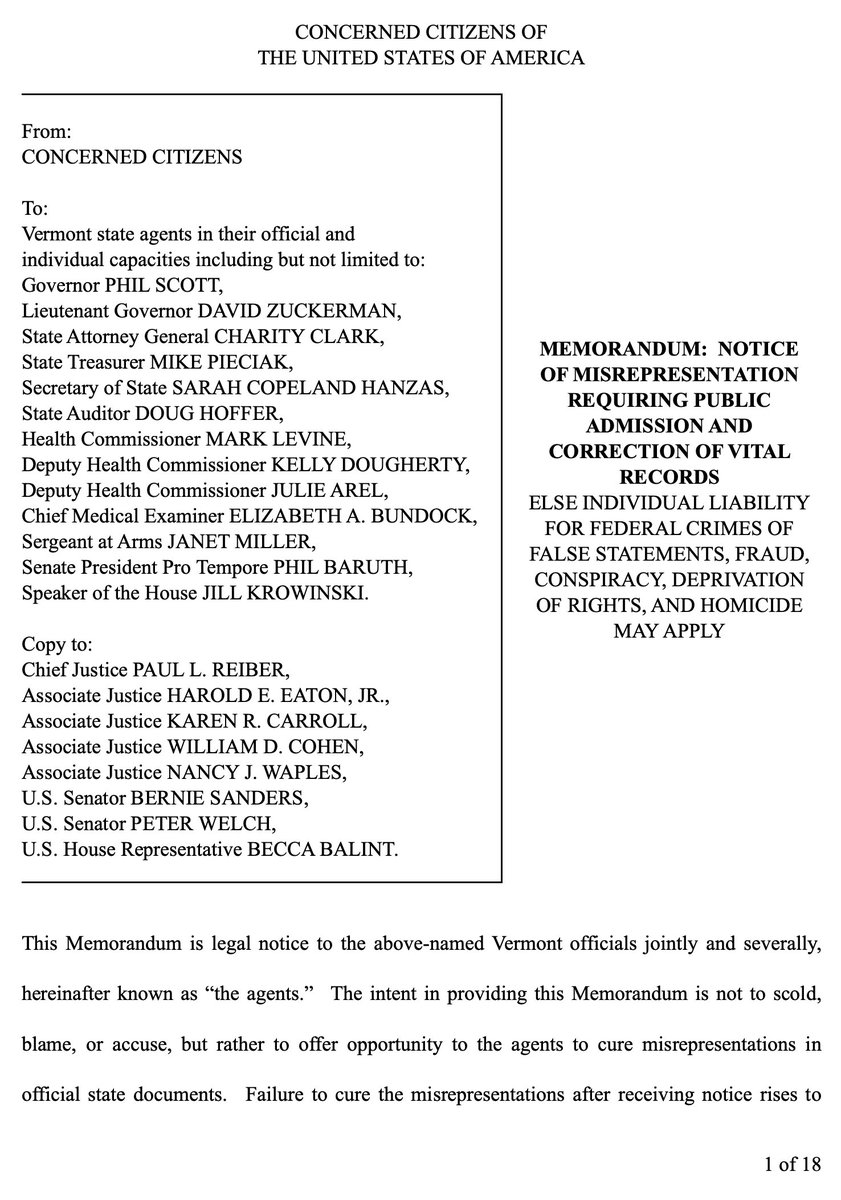
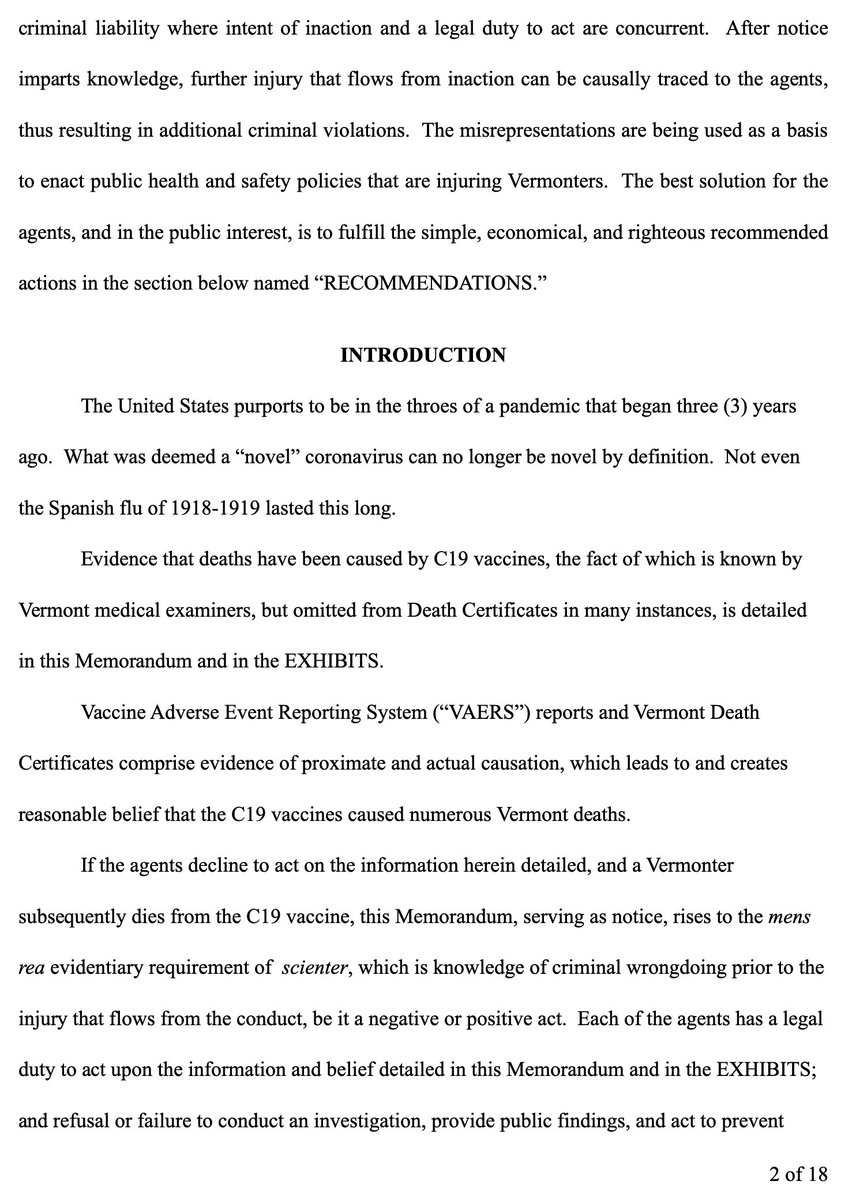
THE VERMONT MEMORANDUM was sent via certified mail yesterday 5/23/2023.
Here is a pic of the front page. Maybe I'll make this a thread.
2/
3/
4/
5/
6/
7/
8/
9/
10/
11/
12/
13/
14/
15/
16/
17/
18/
19/
Why am I doing this?
Because children and adults were murdered by the government.
Because the vexines are a Death Lottery. The lucky who are fine have a responsibility to recognize that a death lottery is illegal, immoral, and participation is murder.
Because God is real.
20/
Because The People need to know that they have been attacked by their governments.
Because The People need to know that these are criminal RICO acts against The People.
Because The People need to DEMAND JUSTICE for the fallen, the maimed, and the depressed who know.
END
• • •
Missing some Tweet in this thread? You can try to
force a refresh
1/ ACUTE RENAL FAILURE involved deaths for Minnesota
Graphs to follow.
I now believe there is more to this than 95% Rmdsvr & 5% vexine cause
Maybe 50% & 50% or maybe interaction of both
Or covid, then jab, then covid again, then Remdesivir?
Who knows? CDC sure doesn't.
2/ 8-Year Wave forms
Clearly, in every age group there are more deaths since the big EUA approval of Remdesivir on October 22, 2020.
In the younger age groups in the lower wave forms, notice the white space under the jagged line. That area under the curve totals deaths.
3/ Cummulative daily deaths are tricky to comprehend.
When line is straight, there are no changes to the number each day. If the slope increases, there are more at that point of increase and thereafter
2-3 wks after Oct22 '20 EUA of Rmdsvr, the slope increases in many age gps
1/ This thread is a few of my printable 8.5x11 data pages. I have 100's.
There is NO bigger study of RECORD-LEVEL SOURCE DATA depicting the past 3 years.
3 Major Changes occurred on a year boundary '20-'21
1.Symptom Spectrum Profile
2.Age Spectrum Profile 3. Seasonality Profile
2/ All-Cause
2020 peak
2021 marginal difference cut in half
Younger ages went up. 20to21
Older ages went down. 20to21
Highly seasonal 1st wave.
Seasonal December 2nd wave.
3/ Younger ages do not show the sine wave of seasonality until the "covid" or "covid jab" externality.
Why is the 3rd wave greater than the 1st wave?
Why does age 25-44 not return to baseline in 3 years?
Ignore last tail-off. Most recent data is not complete yet.
1/ STROKES - phone video from Feb 23, 2023
Some new format slides to see a lot on each slide and compare to what happened with All-Cause and Covid on the same slide in portrait orientation.
STROKES STROKES STROKES MANY MANY STROKES
2/ CDC is dancing with a Limited Hangout again. They're admitting a "rare" and "over 65" issue with the kill_shots and STROKES.
TRUTH = In MA alone, a quick look shows 12yo girl, 17yo girl, 30yo woman and hundreds of elderly. Just a sampling in one state nypost.com/2023/01/14/cdc…
3/ To see the full presentation on strokes from vexine that I mentioned in the video above, go to this link for Jonathan Couey's podcast Gigaohm Biological. twitch.tv/videos/1752664…
For whomever was asking about influenza an pneumonia, here are the numbers. You can deduce from it what you want. Look at the huge numbers in J18.9
2020 flu was Jan, Feb and part of March. Then then went to near zero I believe. I'll find out next slide
As you look at these, keep in mind that a seasonal virus will start in late fall and may blow itself out before end of season. Since covid (or purported covid) entered late in the season, it may not have finished to blow itself out because the warm seasonal trigger came. et al
Remdesivir Thread - 47 sec Video first followed by Massachusetts graphs.
Estimated 100K people were killed by Remdesivir in USA alone. They know or the willfully refuse to know. Either way, it's homicide.
2/ Thousands dead in Massachusetts ARF likely due to Remdesivir. This requires CRIMINAL investigation.
3/ 2020 was only bad for 9 weeks. Then it was normal during the year of covid without vexine.
Then look at 2021 and 2022 all year each year.