This STRATEGY can change your investing style forever!
Identify & Ride 'Massive Trends' in stocks...
... using these 3 simple indicators!🎯
Ready to learn?🤓
Let's go...🧵
Identify & Ride 'Massive Trends' in stocks...
... using these 3 simple indicators!🎯
Ready to learn?🤓
Let's go...🧵
1⃣ First, Let's do a self-check & see if you know how to use
- Pivots to assess stock trend
- Commodity channel index indicator to assess momentum
- Relative strength to assess stock strength
If you know all, skip to number9⃣ for 'THE STRATEGY'
If not, read on...
- Pivots to assess stock trend
- Commodity channel index indicator to assess momentum
- Relative strength to assess stock strength
If you know all, skip to number9⃣ for 'THE STRATEGY'
If not, read on...
Want to copy my trading setup with these 3 indicators?
Watch this video👇
Watch this video👇
2⃣ ok, so using the three indicators i mentioned above we are going to learn an 'INVESTMENT STRATEGY' that can help you...
- Time entries
- Ride massive trends & multibaggers
- Exit stocks when trend reverses
Now, it is time to understand these 3 indicators
- Time entries
- Ride massive trends & multibaggers
- Exit stocks when trend reverses
Now, it is time to understand these 3 indicators
3⃣ First indicator:
In order to understand stock trends, the best indicator using price action for me is 'Pivots'
Pivots help to understand probable changes in stock trends.
In order to understand stock trends, the best indicator using price action for me is 'Pivots'
Pivots help to understand probable changes in stock trends.

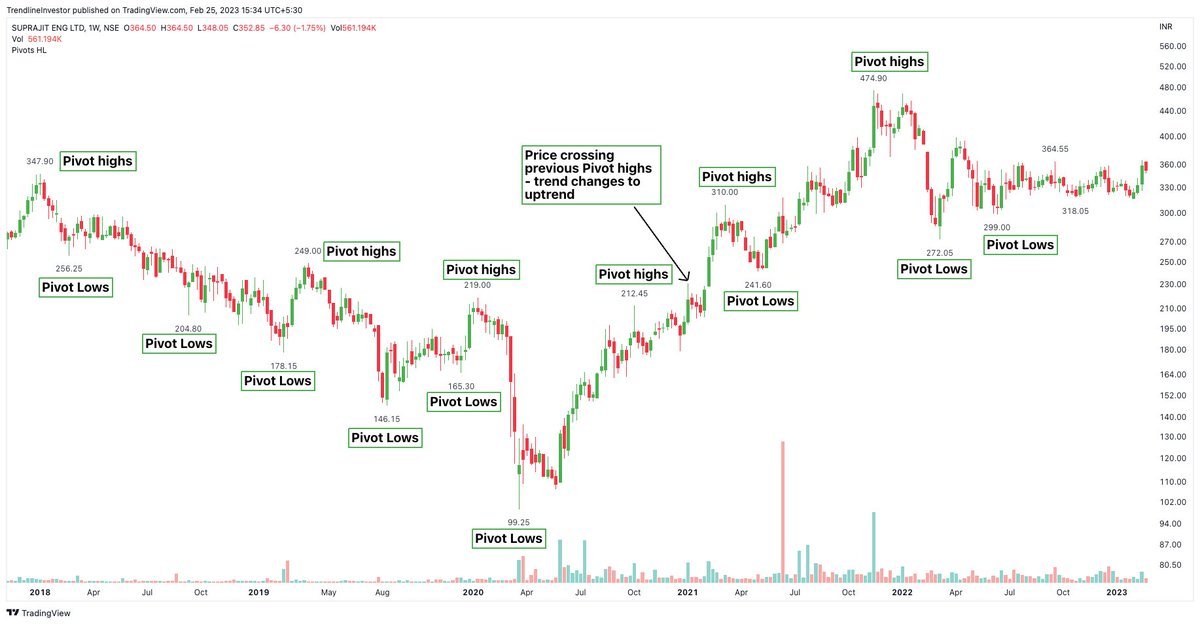
4⃣So, using pivots we are going to now define stock uptrend & downtrend
- Price crossing above previous pivot highs: Stock trend changes to uptrend
- Price crossing below previous pivot lows: Stock trend changes to downtrend
Yes, it's that simple & that's all one needs to know
- Price crossing above previous pivot highs: Stock trend changes to uptrend
- Price crossing below previous pivot lows: Stock trend changes to downtrend
Yes, it's that simple & that's all one needs to know
5⃣ Second indicator:
But, you can't manually scan 1000s of stocks, right?
A scanner would be better & we are going to use CCI for this👇
CCI > 100 -> bullish
CCI<-100 -> bearish
Watch this video for more details
But, you can't manually scan 1000s of stocks, right?
A scanner would be better & we are going to use CCI for this👇
CCI > 100 -> bullish
CCI<-100 -> bearish
Watch this video for more details
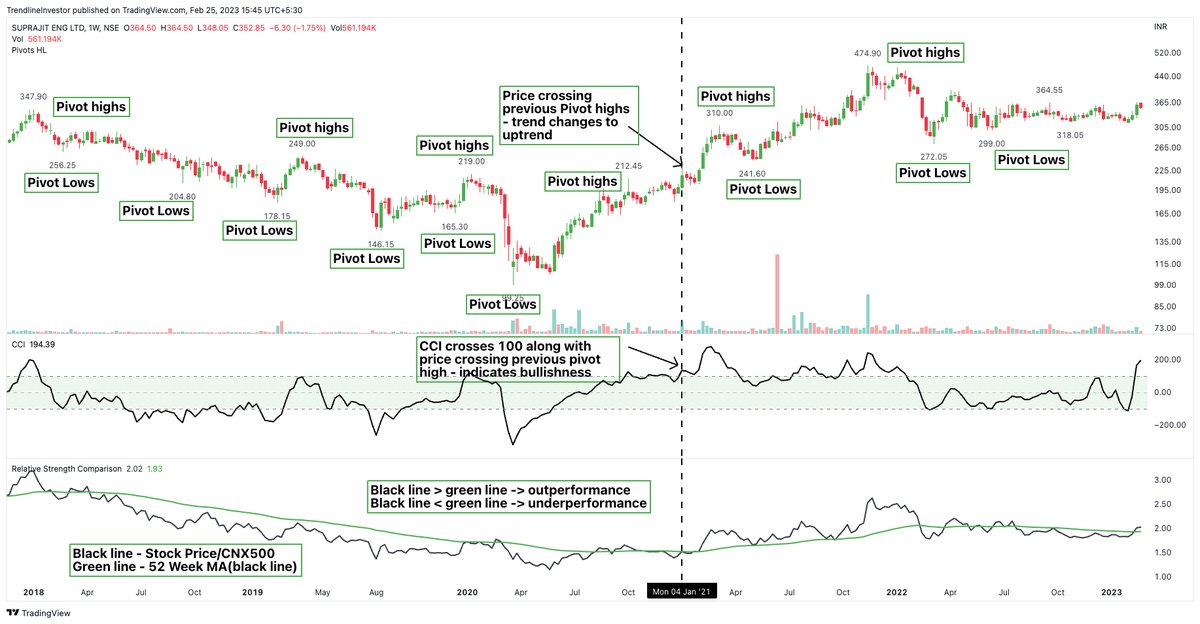
6⃣ Refer to the below chart
When CCI crosses above 100, the stock will appear in your scanner and then you take a look at the chart and check...
If price is also above previous pivot high...
If yes, you have found the next stock for your PF
When CCI crosses above 100, the stock will appear in your scanner and then you take a look at the chart and check...
If price is also above previous pivot high...
If yes, you have found the next stock for your PF
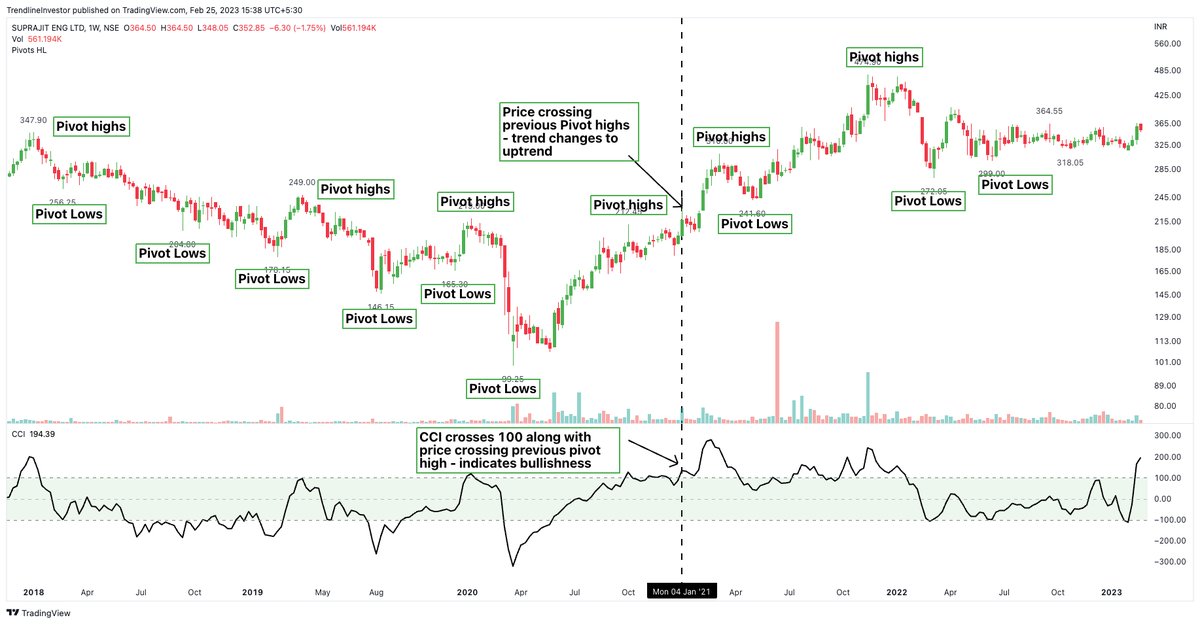
7⃣ Third indicator:
Sometimes though CCI can be above 100 the stock might not perform & that is because of...
Relative strength (RS)!
It is important the stock is outperforming & I use RS to understand this!
RS = stock price/benchmark
More details 👇
Sometimes though CCI can be above 100 the stock might not perform & that is because of...
Relative strength (RS)!
It is important the stock is outperforming & I use RS to understand this!
RS = stock price/benchmark
More details 👇
8⃣ Refer to 'Relative strength comparison' in the chart
Simple Rules:
- Black line > Green line: Stock outperforming
- Black line < Green line: Stock underperforming
Easy?
You can use 'mansfield RS' in Tradingview - I used this indicator to create mine😃
Simple Rules:
- Black line > Green line: Stock outperforming
- Black line < Green line: Stock underperforming
Easy?
You can use 'mansfield RS' in Tradingview - I used this indicator to create mine😃
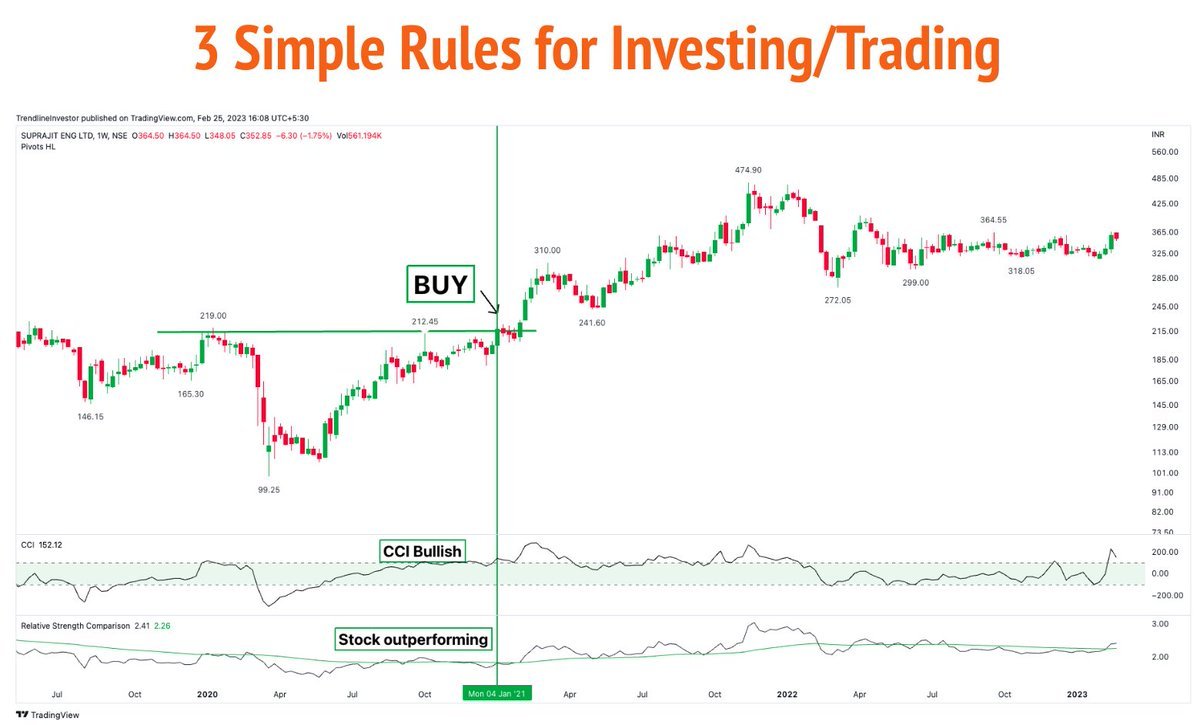
9⃣ Investment Strategy:
Ok, Let's combine the 3 indicators
Buy a stock if:
- CCI(34) > 100 on weekly &
- Black line > Green line &
- Price > previous pivot high
If you're conservative, wait for weekly close above previous pivot high
More details 👇
Ok, Let's combine the 3 indicators
Buy a stock if:
- CCI(34) > 100 on weekly &
- Black line > Green line &
- Price > previous pivot high
If you're conservative, wait for weekly close above previous pivot high
More details 👇
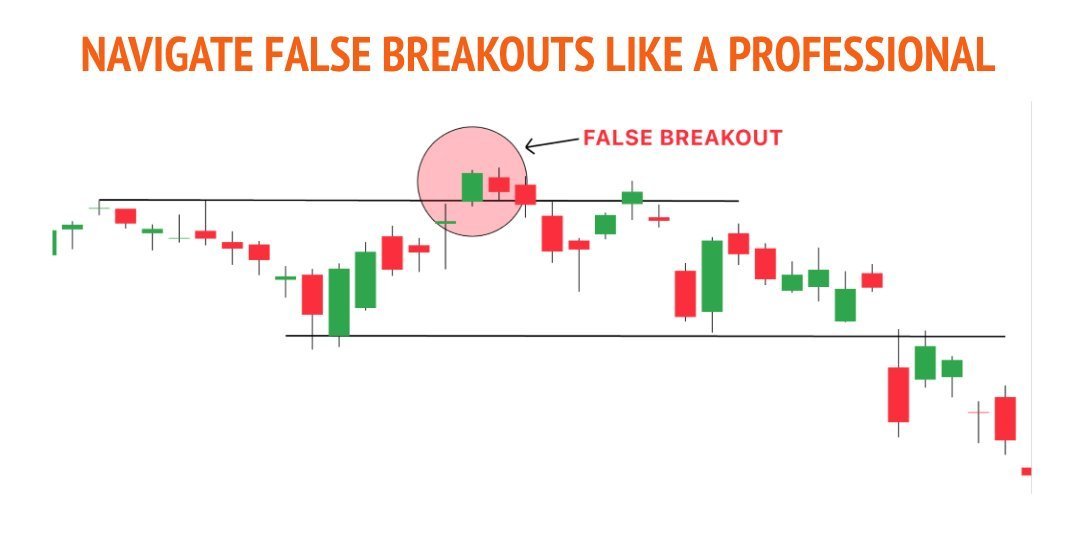
🔟 Sell the stock if:
- Price crossing below previous pivot low
If you are conservative, wait for weekly price close below previous pivot low - might help you avoid shakeouts😃
You can also use this strategy on daily charts for positional trading!
Do DM me for any questions!
- Price crossing below previous pivot low
If you are conservative, wait for weekly price close below previous pivot low - might help you avoid shakeouts😃
You can also use this strategy on daily charts for positional trading!
Do DM me for any questions!
Learnt something? If yes, please👇
1. Retweet the first tweet
2. Follow @dmdsplyinvestor
3. Subscribe to my YouTube channel for more content! youtube.com/c/TrendlineInv…
1. Retweet the first tweet
https://twitter.com/dmdsplyinvestor/status/1661306195896836099?s=20
2. Follow @dmdsplyinvestor
3. Subscribe to my YouTube channel for more content! youtube.com/c/TrendlineInv…
• • •
Missing some Tweet in this thread? You can try to
force a refresh