
What pre-tax returns, ITC stockholders of each holding timeframe are making (ex-dividend) - A thread 🧵
1. 15 yr holding period (12.8%)
#ITC
1. 15 yr holding period (12.8%)
#ITC

2. 10 yr holding period (6.9%)

3. 5 yr holding period (10.2%)

4. 3 yr holding period (30.8%)

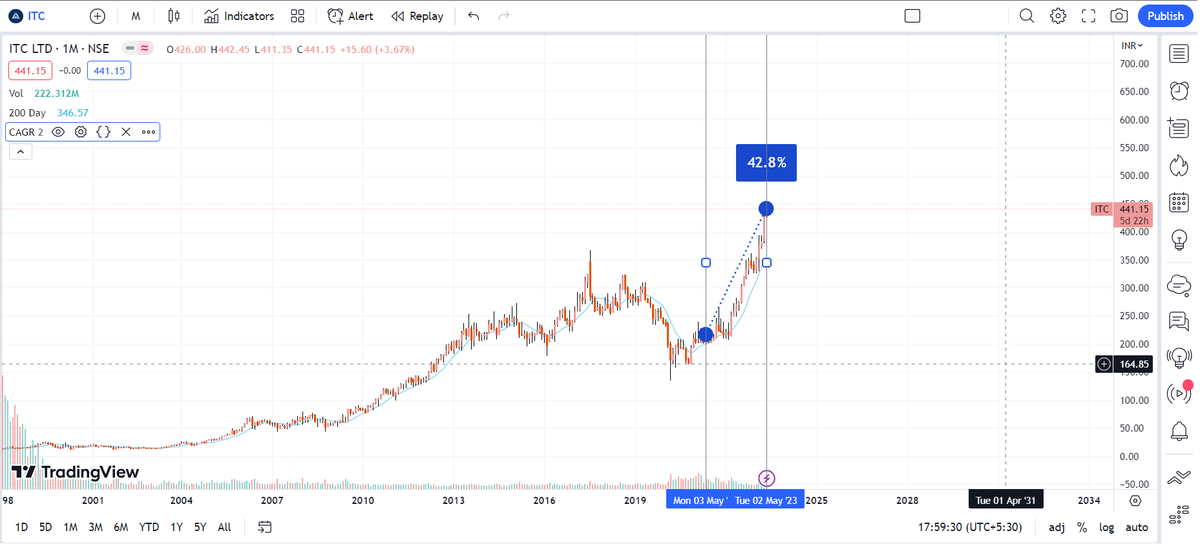
5. 2 yr holding period (42.8%)
6. 1 yr holding period (63%)

7. 6 month holding period (98.5%)

1. 15 yr holding period (12.8%)
2. 10 yr holding period (6.9%)
3. 5 yr holding period (10.2%)
4. 3 yr holding period (30.8%)
5. 2 yr holding period (42.8%)
6. 1 yr holding period (63%)
7. 6 month holding period (98.5%)
2. 10 yr holding period (6.9%)
3. 5 yr holding period (10.2%)
4. 3 yr holding period (30.8%)
5. 2 yr holding period (42.8%)
6. 1 yr holding period (63%)
7. 6 month holding period (98.5%)
Observations:
a. Stock is at ATH
b. Reinvest dividends to improve long term returns
c. 10 yr holders are making bank FD returns
d. Only investors from past 3 years are making above average returns.
If you liked this format, comment👇what other stock you'd like analysed this way
a. Stock is at ATH
b. Reinvest dividends to improve long term returns
c. 10 yr holders are making bank FD returns
d. Only investors from past 3 years are making above average returns.
If you liked this format, comment👇what other stock you'd like analysed this way
• • •
Missing some Tweet in this thread? You can try to
force a refresh


