I've just created this chart using AI.
And it only took me a few seconds.
Here's how to create any chart or graph with AI (for free):
And it only took me a few seconds.
Here's how to create any chart or graph with AI (for free):

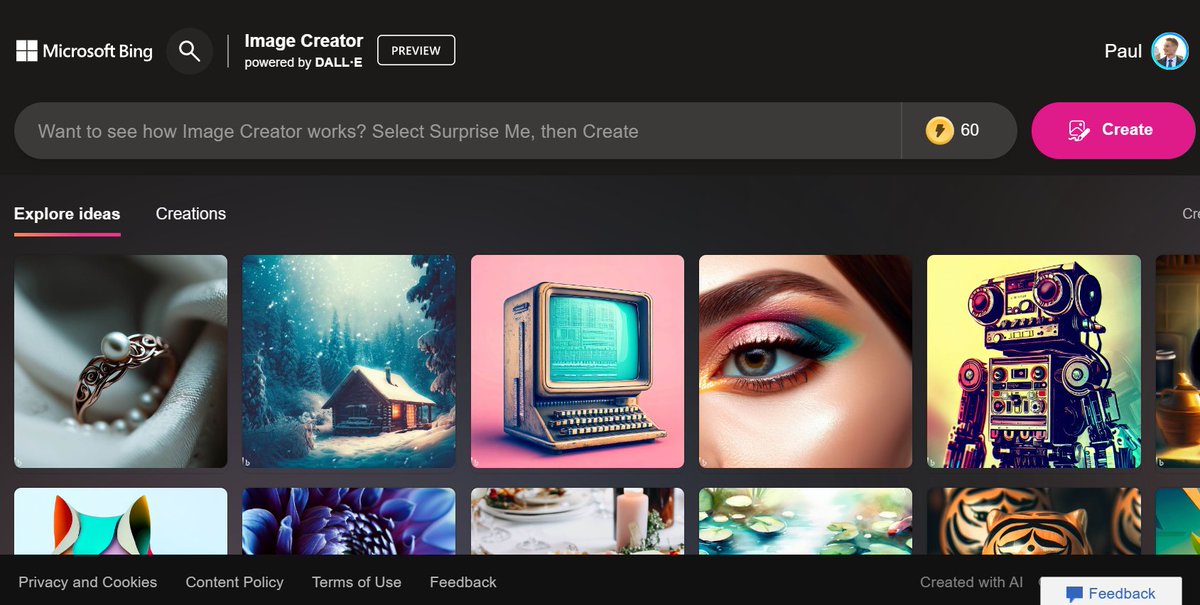
1. Go to Bing
We're going to use Bing Chat in creative mode.
Go to bing.com/chat and select "Creative" (log in to avoid limits).
We're going to use Bing Chat in creative mode.
Go to bing.com/chat and select "Creative" (log in to avoid limits).
2. Find data
Enter this prompt to find the data for your graph and the "code" for drawing it.
The prompt is available just below.
Enter this prompt to find the data for your graph and the "code" for drawing it.
The prompt is available just below.
Prompt → I want to create a chart for Google Sheets with the evolution of smartphone sales from 2016 to 2023 in the USA by brand. Show me a table with the data I can copy/paste and write the code for a Google Sheets macro to automatically draw the line chart.
3. Copy data into Google Sheets
Copy/paste the table directly into a new Google Sheets file.
Copy/paste the table directly into a new Google Sheets file.
4. Copy the code
Copy the code Bing has given you, as shown in the video. Then click on "Run".
Google Sheets may ask you for authorization, but there's no risk.
Copy the code Bing has given you, as shown in the video. Then click on "Run".
Google Sheets may ask you for authorization, but there's no risk.
5. You're done!
Your graph has been created automatically, and you can even modify it.
Your graph has been created automatically, and you can even modify it.
Hope this was useful to you!
If you enjoyed this thread, please:
1. Follow me (@itsPaulAi) for more AI content
2. Like & Retweet the first tweet below:
If you enjoyed this thread, please:
1. Follow me (@itsPaulAi) for more AI content
2. Like & Retweet the first tweet below:
https://twitter.com/itsPaulAi/status/1662084797475241984?s=20
If this was helpful to you, you would also like my newsletter coming soon!
I'll share for free with you:
→ Tutorials to use AI
→ No-code tools
→ Tech tips
Join us for free:
itspaulai.gumroad.com/subscribe
I'll share for free with you:
→ Tutorials to use AI
→ No-code tools
→ Tech tips
Join us for free:
itspaulai.gumroad.com/subscribe
• • •
Missing some Tweet in this thread? You can try to
force a refresh