
Stop searching for random tools to identify HOW and WHEN to BUY THE DIP.
In the next 5 minutes I’m going to share this amazing strategy called “BTFD”
Using this you can BUY LOW & SELL HIGH
Click on “Show this thread” to get the strategy 👇
In the next 5 minutes I’m going to share this amazing strategy called “BTFD”
Using this you can BUY LOW & SELL HIGH
Click on “Show this thread” to get the strategy 👇

So the strategy name is BTFD and no its not a slang. Its the Buy the Fibo Dip.
Do you ever see sometimes the stock gives a fake breakout and gives a deep pullback and quickly reverses within days trapping you in your buy position ??
Say no more.
Do you ever see sometimes the stock gives a fake breakout and gives a deep pullback and quickly reverses within days trapping you in your buy position ??
Say no more.

Major Prerequisite :
Always use it in a trending stock.
Always use it in a trending stock.

Tool :
Use a tool named Fibonacci Retracement which is easily available in Trading view or any brokers charting platform.
Use a tool named Fibonacci Retracement which is easily available in Trading view or any brokers charting platform.

As depicted here you have to use fibo from Point A (Bottom or start of trend) to Point B (temporary end of trend)
Drag the fibo and you will get many levels like 0.382,0.618,0.786.
Instead of getting confused from all these levels im going to tell you which are the 2 levels..
Drag the fibo and you will get many levels like 0.382,0.618,0.786.
Instead of getting confused from all these levels im going to tell you which are the 2 levels..

Settings to change :
Go to the Indicator settings and just use 2 levels. 0.5 & 0.618 that's it.
These levels are golden ratios and are used widely by traders and institutions. These are the most reactive levels and hence we use them to buy Deep pullbacks.
Go to the Indicator settings and just use 2 levels. 0.5 & 0.618 that's it.
These levels are golden ratios and are used widely by traders and institutions. These are the most reactive levels and hence we use them to buy Deep pullbacks.

Once you are done with plotting from Point A to Point B the next step is to see whether the price is touching these levels. You can call them the “Fibo Band” the band of 0.5&0.618 levels.
Pretty accurate Demand & Supply band to buy deep pullbacks.
Pretty accurate Demand & Supply band to buy deep pullbacks.
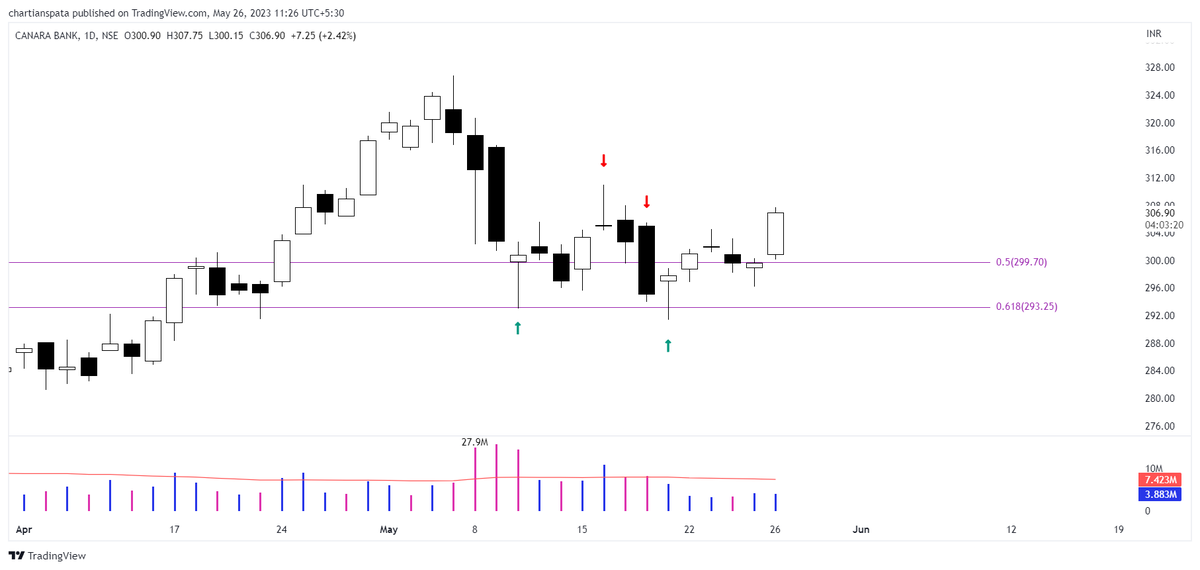
After a bullish formation like this chart below. All you have to do is time the entry. The strategy is such that you have to merge candles or see a bullish contraction.

The best entry could be any undercut of price that happens at the 0.618 level with force where bears are trapped.
See this example of Canbk and Cumminsind. How the level was defended with an undercut.
See this example of Canbk and Cumminsind. How the level was defended with an undercut.


How to enter these deep under cuts ?
Usually you will see these undercuts happening in intraday. And the best tools you can use is Fibo on smaller timeframe to find smaller swings.
Usually you will see these undercuts happening in intraday. And the best tools you can use is Fibo on smaller timeframe to find smaller swings.

Other technique is using important support and resistance levels and some also use VWAP or some MACO (MA crossovers)
Complete discretion within a framework.
Complete discretion within a framework.


Stoploss ?
If you are playing intraday you might want to use those demand and supply zones to get a stop but for positional trading here is how to place them.
If the stock is coming out of a range then the low of the range can be your stoploss.
If you are playing intraday you might want to use those demand and supply zones to get a stop but for positional trading here is how to place them.
If the stock is coming out of a range then the low of the range can be your stoploss.

If the breakout is coming with a strong candle but not with a good range then the BO candle low can be the stoploss.
Sometimes you can even go down on Lower TF and use smaller pull backs on EMAs to enter. Completely upto you.
Sometimes you can even go down on Lower TF and use smaller pull backs on EMAs to enter. Completely upto you.

Targets ?
Many rules to book gains in stock. You might want to use 2 modules that we use. SIS or SIW.
Use R based levels to book partial gains and ride big. Or else here’s an amazing way to book gains on this strategy.
Many rules to book gains in stock. You might want to use 2 modules that we use. SIS or SIW.
Use R based levels to book partial gains and ride big. Or else here’s an amazing way to book gains on this strategy.

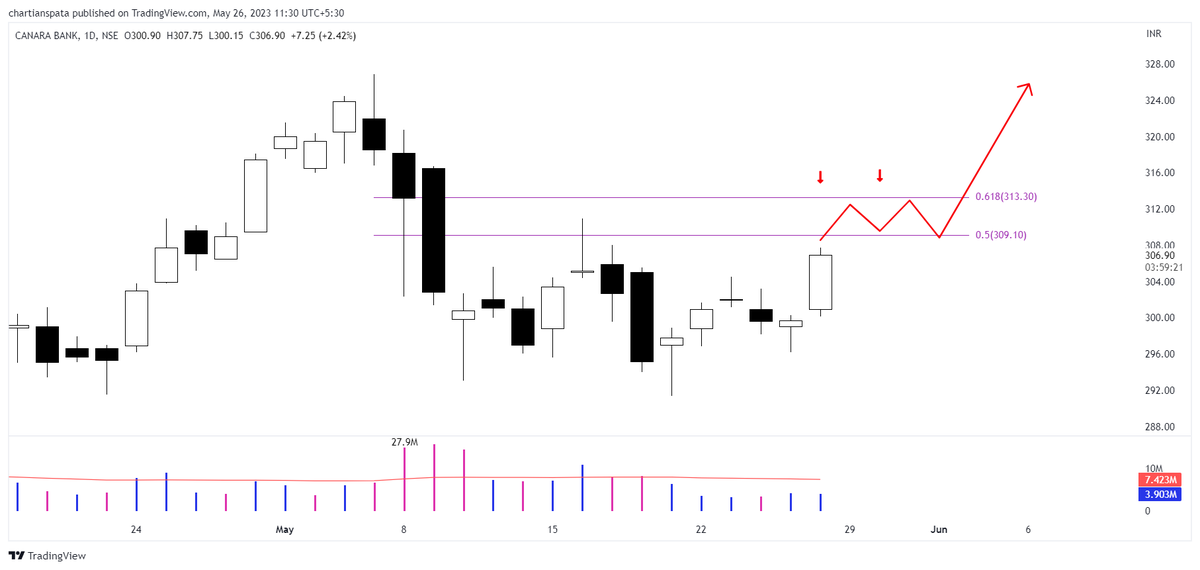
Using that overhead supply use a fibo for the dip and see where is the possible Fibo Band arriving on upside to book gains.

Best to use when ?
Best to use in HTF Up trending stocks, use fibo to buy pullbacks and Up average your positions.
Intraday mean reversion and Buying the dip.
Using it as resistance zone in a falling stock.
Best to use in HTF Up trending stocks, use fibo to buy pullbacks and Up average your positions.
Intraday mean reversion and Buying the dip.
Using it as resistance zone in a falling stock.


Loved it ? Want more of such PA based strategies? Worry not !
Like and Retweet this below tweet :
Join our TG : https://t.co/zWkyqL9Tl4
Follow us @chartians
Tag us using your charts. We will try our best to reply to them. The strategy name is #BTFD… twitter.com/i/web/status/1…
Like and Retweet this below tweet :
https://twitter.com/chartians/status/1662420418819657735?s=20
Join our TG : https://t.co/zWkyqL9Tl4
Follow us @chartians
Tag us using your charts. We will try our best to reply to them. The strategy name is #BTFD… twitter.com/i/web/status/1…


• • •
Missing some Tweet in this thread? You can try to
force a refresh


