The ULTIMATE Indicator - ‘RELATIVE STRENGTH (RS)’!
It is NOT your typical RSI…🤓
...but a crucial tool that can transform your trading/investing approach!
Let's unpack it using the #TATASTEEL chart...📈
Let’s go 🧵…
It is NOT your typical RSI…🤓
...but a crucial tool that can transform your trading/investing approach!
Let's unpack it using the #TATASTEEL chart...📈
Let’s go 🧵…
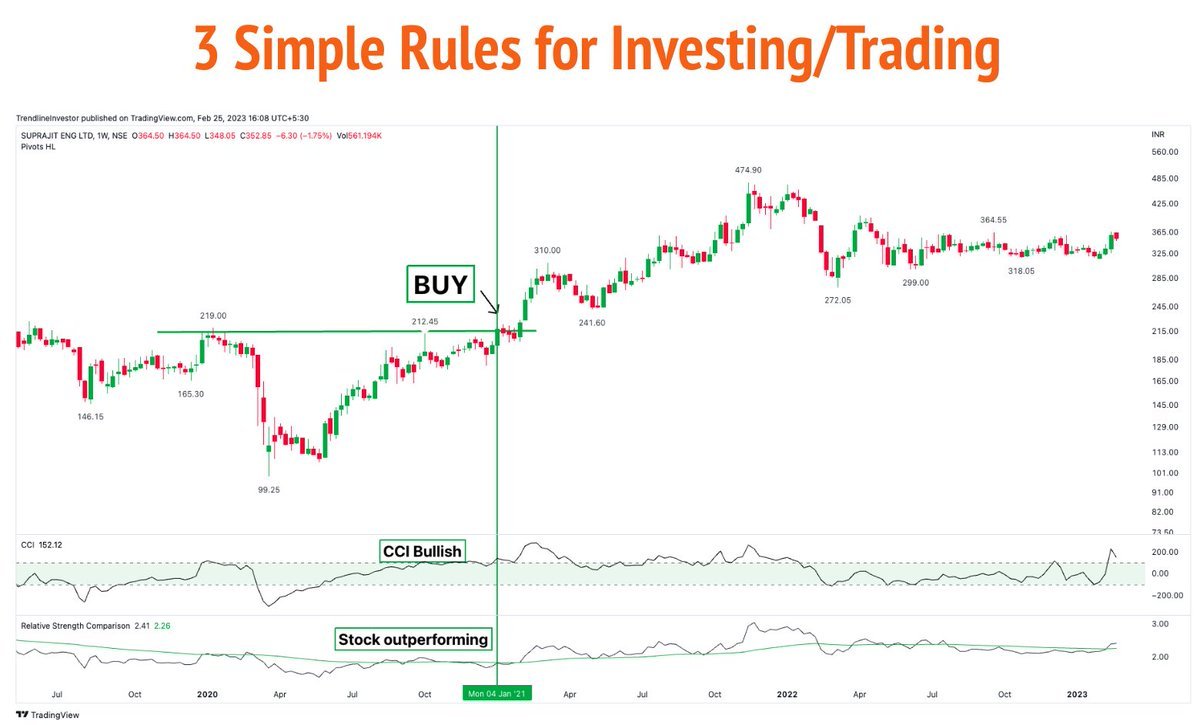
1⃣ But, how will it change the way I trade?
- Ever wondered why the stock you are holding is not moving when the market is ripping higher?
Ex: ITC didn't move btwn June’20 & Feb’22 while the market rallied
This indicator will help you get rid of such underperforming stocks.
- Ever wondered why the stock you are holding is not moving when the market is ripping higher?
Ex: ITC didn't move btwn June’20 & Feb’22 while the market rallied
This indicator will help you get rid of such underperforming stocks.

2⃣ ok, what’s RS?
When stock A goes...
- up faster than Nifty, it is STRONG/OUTPERFORMING relative to Nifty
- down faster than Nifty, it is WEAK/UNDERPERFORMING relative to Nifty
So, RS is relative performance of a stock compared to any benchmark (refer chart for example)
When stock A goes...
- up faster than Nifty, it is STRONG/OUTPERFORMING relative to Nifty
- down faster than Nifty, it is WEAK/UNDERPERFORMING relative to Nifty
So, RS is relative performance of a stock compared to any benchmark (refer chart for example)

Like to watch a video explanation?
Then watch this video where I explain all of this in detail!
Then watch this video where I explain all of this in detail!
3⃣ Let’s dig deeper:
A stock is outperforming/strong when
- Nifty is going up, but the stock is going up much faster than Nifty
- Nifty is going down, but the stock is going down much slower than Nifty or going up
A stock is outperforming/strong when
- Nifty is going up, but the stock is going up much faster than Nifty
- Nifty is going down, but the stock is going down much slower than Nifty or going up
4⃣ More definitions:
A stock is underperforming/weak when
- Nifty is going down, but the stock is going down much faster than Nifty
- Nifty is going up, but the stock is going up lesser than Nifty or going down
A stock is underperforming/weak when
- Nifty is going down, but the stock is going down much faster than Nifty
- Nifty is going up, but the stock is going up lesser than Nifty or going down
5⃣ Moving on to examples…
- If a stock has gone up from 100 to 500 in the last 6 months & Nifty has gone up from 10000 to 15000 in the last 6 months, then you can say the stock has gone up 5 times & Nifty has gone up only 50%.
This shows that the RS of the stock is Strong
- If a stock has gone up from 100 to 500 in the last 6 months & Nifty has gone up from 10000 to 15000 in the last 6 months, then you can say the stock has gone up 5 times & Nifty has gone up only 50%.
This shows that the RS of the stock is Strong
6⃣Let's calculate RS...
- Ex: stock price @ 100 & Nifty @ 10k
- Divide the stock price/Nifty
- 100/10000=0.01
- To make it easily understandable, let’s multiply this by 100. So, 0.01*100=1.
So, this is what we did.
RS = (Stock Price/Nifty Price) * 100 = (100/10000)*100 = 1
- Ex: stock price @ 100 & Nifty @ 10k
- Divide the stock price/Nifty
- 100/10000=0.01
- To make it easily understandable, let’s multiply this by 100. So, 0.01*100=1.
So, this is what we did.
RS = (Stock Price/Nifty Price) * 100 = (100/10000)*100 = 1
7⃣ Time for graphs..
If you continue to do the above every day until the stock reaches 500 & Nifty reaches 15000 & if you plot it in a graph with the ratio on the y-axis & time on the x-axis, y'll notice a rising line chart
This tells you stock is clearly outperforming Nifty
If you continue to do the above every day until the stock reaches 500 & Nifty reaches 15000 & if you plot it in a graph with the ratio on the y-axis & time on the x-axis, y'll notice a rising line chart
This tells you stock is clearly outperforming Nifty

8⃣ Let’s do the reverse…
If the stock is not going up as much as Nifty or if the stock is going down when Nifty is going up, then you will see a line/graph chart where the trend is down, as shown below.
If the stock is not going up as much as Nifty or if the stock is going down when Nifty is going up, then you will see a line/graph chart where the trend is down, as shown below.

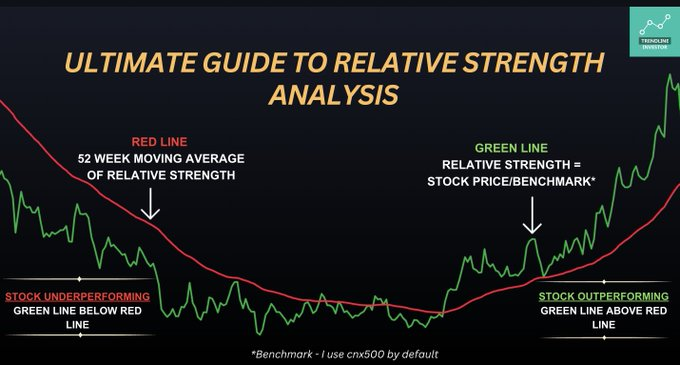
9⃣Adding a 52 week MA to the RS…
- Let's add a 52 week exponential moving average(red line) of the RS that will help us understand RS trend of the last 1 yr
- The red line is much smoother & shows that the average RS was in a strong downtrend before trending up.
- Let's add a 52 week exponential moving average(red line) of the RS that will help us understand RS trend of the last 1 yr
- The red line is much smoother & shows that the average RS was in a strong downtrend before trending up.

🔟 Let’s simply it…
- If the RS is above the 52 wk MA(red line), this signals that the RS is moving higher or the stock is outperforming Nifty
- If the RS is below the 52 wk MA(red line), this signals that the RS is moving lower or the stock is underperforming Nifty
- If the RS is above the 52 wk MA(red line), this signals that the RS is moving higher or the stock is outperforming Nifty
- If the RS is below the 52 wk MA(red line), this signals that the RS is moving lower or the stock is underperforming Nifty
You can also find outperforming sector/stocks with a slightly different perspective.
Watch this video👇
Watch this video👇
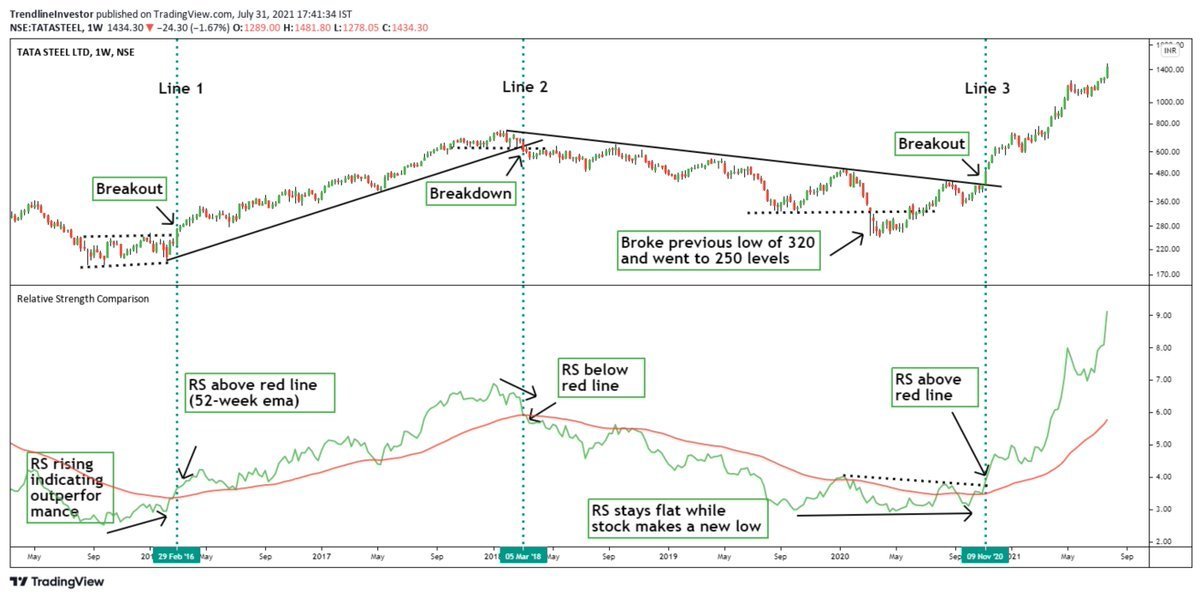
1⃣1⃣ Let’s take a real example #Tatasteel...
- In the below chart, around Line 1, the price remained flat but RS kept rising - outperformance
- Later the stock price also broke out from consolidation & started a long term uptrend that lasted for 2 long years from 2016 to 2018.
- In the below chart, around Line 1, the price remained flat but RS kept rising - outperformance
- Later the stock price also broke out from consolidation & started a long term uptrend that lasted for 2 long years from 2016 to 2018.

1⃣2⃣Stock starts to underperform...
- In '18 after a 2 yr strong uptrend (Line 2), RS went below the red line & the stock price also broke down from an uptrend & started heading lower
- Since, '18 RS line has always stayed well below the red line indicating underperformance
- In '18 after a 2 yr strong uptrend (Line 2), RS went below the red line & the stock price also broke down from an uptrend & started heading lower
- Since, '18 RS line has always stayed well below the red line indicating underperformance

1⃣3⃣ Tatasteel rises
- In '20 crash (Line 3), the RS was flat while price went down to 250
- RS remained flat coz price fell lesser than Nifty
- In Nov’20 price broke the downtrend & went higher & RS crossed red line too
- Since that breakout Tatasteel has outperformed Nifty
- In '20 crash (Line 3), the RS was flat while price went down to 250
- RS remained flat coz price fell lesser than Nifty
- In Nov’20 price broke the downtrend & went higher & RS crossed red line too
- Since that breakout Tatasteel has outperformed Nifty
Want to copy my trading setup with this relative strength indicator?
Watch this video👇
Watch this video👇
1⃣4⃣ Uff.. too much info? 🤓
Want the indicator?
Indicator link
tradingview.com/script/dfNpAY5…
or
Search for this indicator 👇in TV or just find the one that suits you
Want the indicator?
Indicator link
tradingview.com/script/dfNpAY5…
or
Search for this indicator 👇in TV or just find the one that suits you


Learnt something? If yes, please👇
1. Retweet the first tweet
2. Follow @dmdsplyinvestor
3. Subscribe to my YouTube channel for more content! youtube.com/c/TrendlineInv…
1. Retweet the first tweet
https://twitter.com/dmdsplyinvestor/status/1662723835366457347?s=20
2. Follow @dmdsplyinvestor
3. Subscribe to my YouTube channel for more content! youtube.com/c/TrendlineInv…
• • •
Missing some Tweet in this thread? You can try to
force a refresh