90% of day traders are LOSS MAKING because of not FOLLOWING THE TREND.
Its not their mistake because no-one taught them HOW TO TRADE WITH THE TREND.
Here is a FREE COURSE (sold for 50,000₹ online) that will help you catch the RIGHT STOCKS in Markets. twitter.com/i/web/status/1…
Its not their mistake because no-one taught them HOW TO TRADE WITH THE TREND.
Here is a FREE COURSE (sold for 50,000₹ online) that will help you catch the RIGHT STOCKS in Markets. twitter.com/i/web/status/1…

Trading against the trend, without a trend, or poor quality trends are one of the most common reasons for trade failure. The quality or strong trends have more predictable success (edge).
The price goes through 4 Phases
ACCUMULATION (sideways market)
UPTREND(trending up)
DISTRIBUTION (sideways market)
DOWNTREND (trending down)
ACCUMULATION (sideways market)
UPTREND(trending up)
DISTRIBUTION (sideways market)
DOWNTREND (trending down)

Accumulation Market :
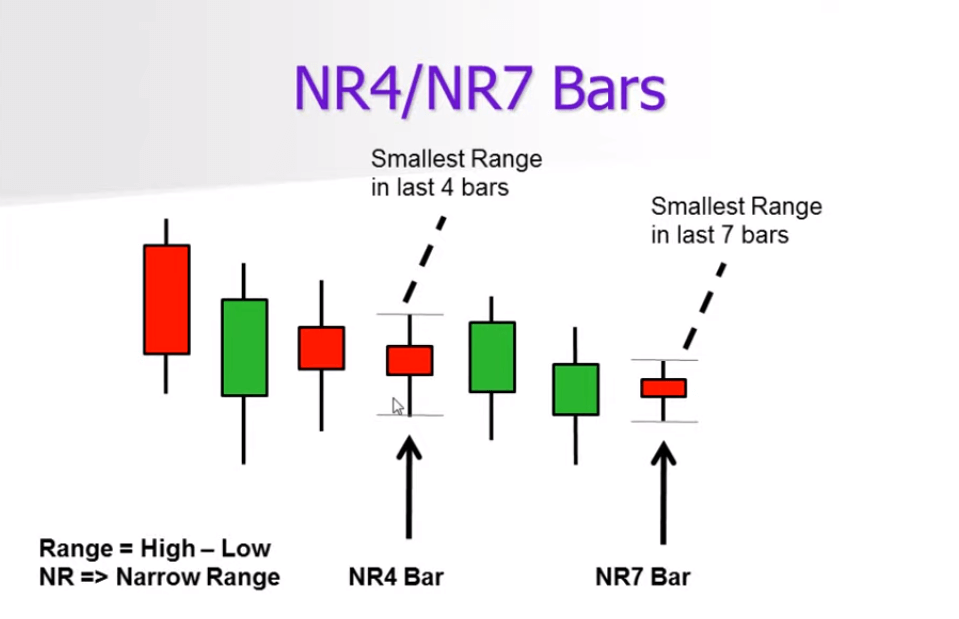
Normal or narrow range candle
Both mix the green and red candle
Low volume
Take more time
Price in a tight range
Normal or narrow range candle
Both mix the green and red candle
Low volume
Take more time
Price in a tight range

Uptrend Market :
Smart money aggressively moving prices up. The advancing phase is essentially an uptrend with prices making higher highs and lows. Market move in up and downswing.
Smart money aggressively moving prices up. The advancing phase is essentially an uptrend with prices making higher highs and lows. Market move in up and downswing.

Downtrend Market :
SM will take advantage of the higher prices obtained in the rally to take profits by beginning to sell the stock back to the uninformed traders/investors
SM will take advantage of the higher prices obtained in the rally to take profits by beginning to sell the stock back to the uninformed traders/investors

Now that we know that there are 4 types of market. Let us analyze how do we do multi timeframe analysis.
Multi time frame analysis is nothing but Top to Bottom Analysis of any chart.
So lets dig in the charts and see how we can make a strategy out of it.
Multi time frame analysis is nothing but Top to Bottom Analysis of any chart.
So lets dig in the charts and see how we can make a strategy out of it.

Prices are fractal in nature, there will always be a law of average. What goes up has to come down, what comes down has to go up.
Prices also have the feature that what reflects on HTF will reflect on LTF.
Prices also have the feature that what reflects on HTF will reflect on LTF.
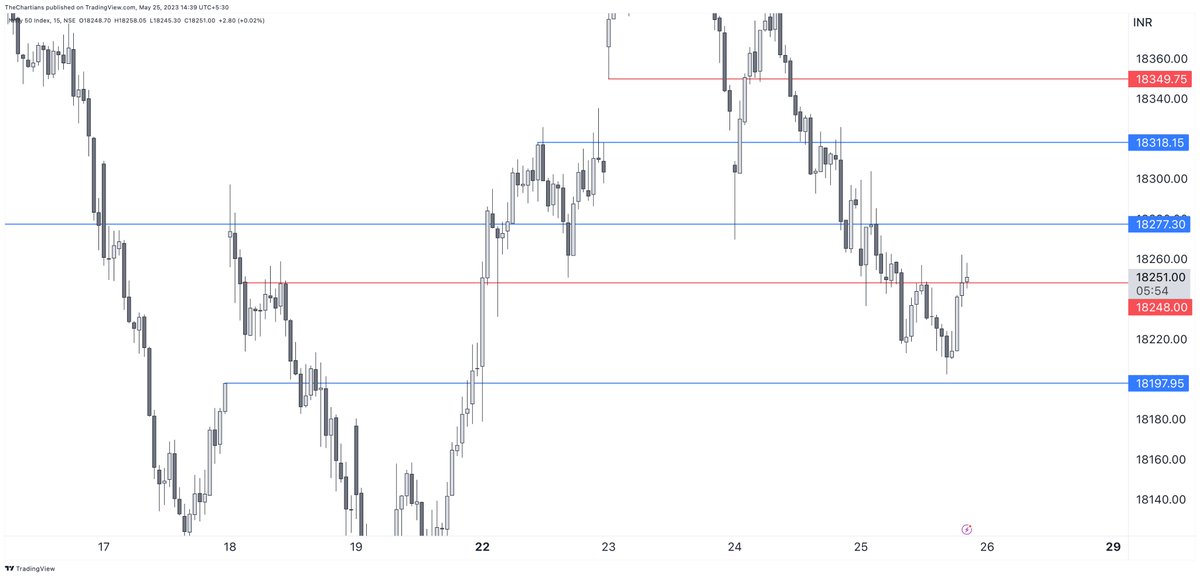
Lets us take an example where we see chart of #BEL
This is a weekly chart of BEL where we can clearly see its in an uptrend. What do we do in up trending stocks ?
We look for buying opportunities. In the next tweet i will show you how to used daily and 15 min charts to enter.
This is a weekly chart of BEL where we can clearly see its in an uptrend. What do we do in up trending stocks ?
We look for buying opportunities. In the next tweet i will show you how to used daily and 15 min charts to enter.

Multiple breakouts on Daily were spotted which helped us enter in this stock on every breakout.

There are two major rules for multiple timeframe analysis:
Larger Timeframes provide a clean picture.
Reversals start from the smaller timeframes first and propagate upwards.
NAVIN monthly and daily and hourly chart for understanding.
Larger Timeframes provide a clean picture.
Reversals start from the smaller timeframes first and propagate upwards.
NAVIN monthly and daily and hourly chart for understanding.


HOW TO USE MULTIPLE TIME FRAMES?
Use 1:
We will be able to differentiate a “pullback” on the smaller time frame chart vs. the beginning of a correction in the larger time frame.
Use 1:
We will be able to differentiate a “pullback” on the smaller time frame chart vs. the beginning of a correction in the larger time frame.

Use 2:
We will be able to read the “smaller” timeframes to see when that pullback is about to reverse. This will help us time our entries better.
We will be able to read the “smaller” timeframes to see when that pullback is about to reverse. This will help us time our entries better.


Advantages of using multiple time frames :
Micro view of HTF and Macro view of LTF
Better entries
Helps ride a bigger trend
Micro view of HTF and Macro view of LTF
Better entries
Helps ride a bigger trend

I hope this thread added some value to your trading, we will be posting more such threads (twice or thrice a week)
It takes efforts to make these so do like and retweet this below tweet :
Also dont forget to @chartians !
For daily trades :… twitter.com/i/web/status/1…
It takes efforts to make these so do like and retweet this below tweet :
https://twitter.com/chartians/status/1662768339842904064?s=20
Also dont forget to @chartians !
For daily trades :… twitter.com/i/web/status/1…
• • •
Missing some Tweet in this thread? You can try to
force a refresh