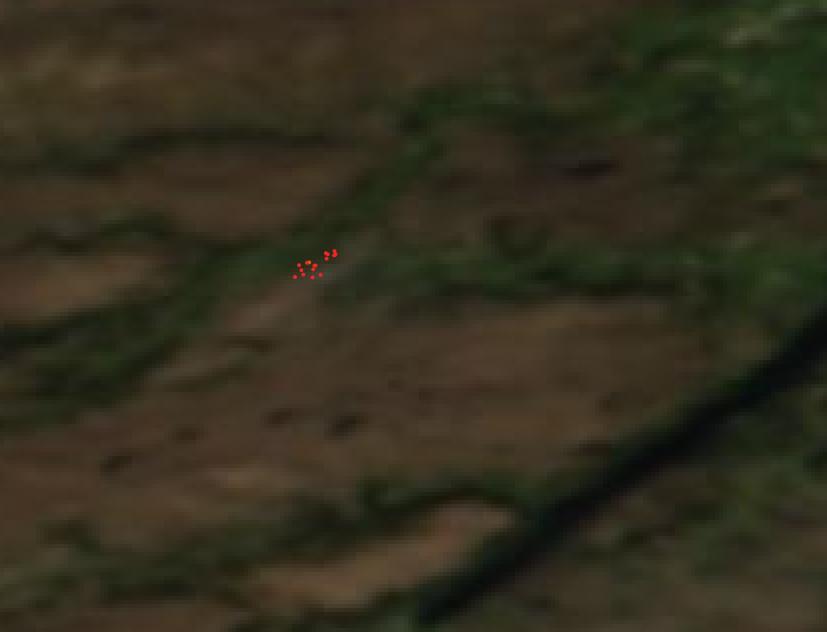
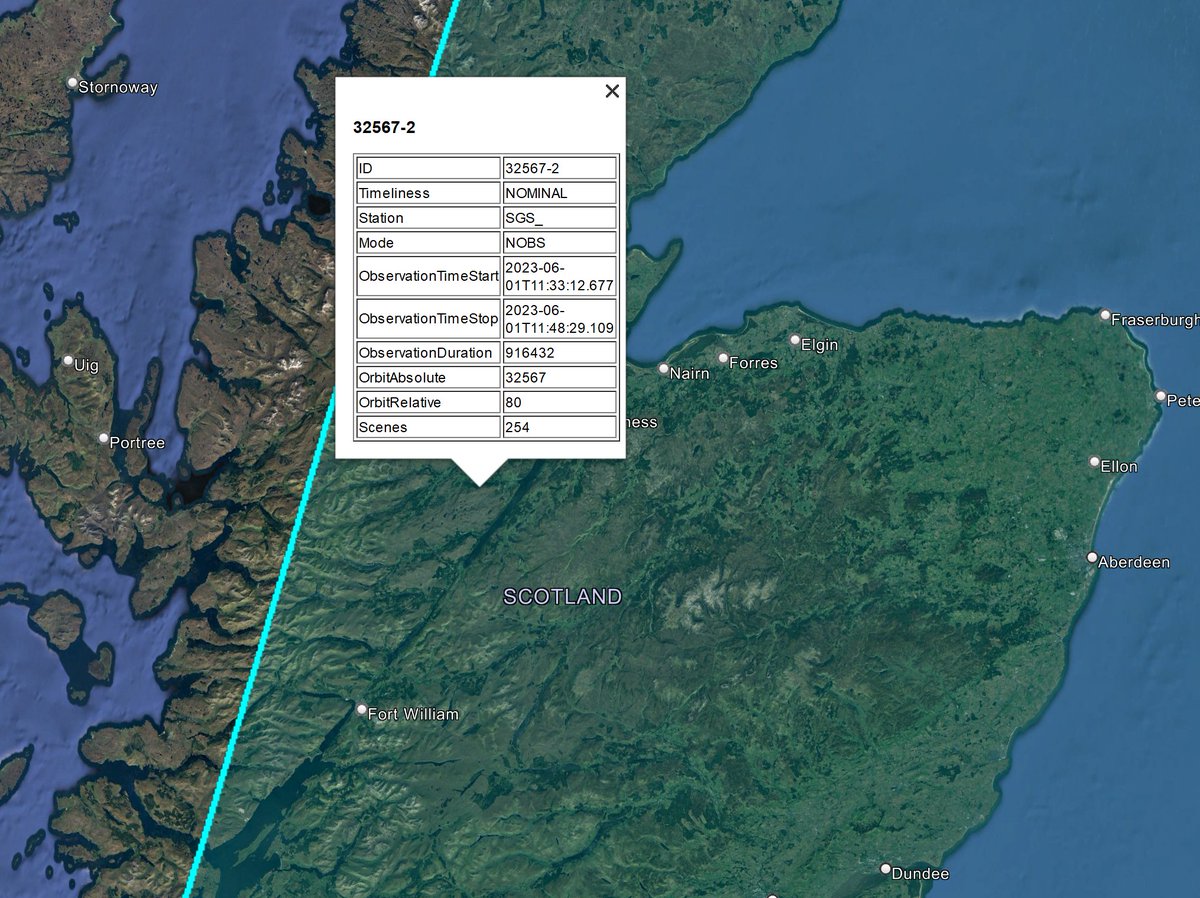
This #wildfire in Cannich is sending a large smoke plume over Loch Ness. This fire has the potential to be one of Scotland's largest (in the satellite era). It's already approaching 3,000 ha and does not appear to be under control with strong winds. @fire_scot
This was the same area on 29 May & 26 May, respectively, showing hotspots here for a few days, suggesting today's acceleration is a flare-up/rekindling of a fire from last week/the weekend.
There was a @sentinel_hub overpass today around midday, centred over this fire. I'll post an update with high-res imagery as soon as it appears online. This is usually around 8 pm. The next overpass isn't until Thursday.
Here's the Sentinel-2 imagery from today @sentinel_hub -- this was captured around midday, so before the MODIS hotspots in the earlier tweets. However, we get a better picture of the fire dynamics on the ground at that time.
Processed using @Pierre_Markuse custom script.
In this wider view, you can see why this wildfire has a lot of potential if it isn't contained overnight. When the satellites overpassed, this fire was ~1,000-2,000 ha (high uncertainty due to low resolution of MODIS hotspots), but it could be much larger by tomorrow.
I think the fire behaviour became more intense after this Sentinel acquisition around midday. By Aqua's imagery at ~2 pm, the smoke plume was far more prominent and the burnt area looks to be larger. Suggesting very fast rate-of-spread in the afternoon.
Important update on the Cannich wildfire. Imagery from today (31 May) shows the fire was contained shortly after yesterday's satellite overpasses. It's unlikely this wildfire exceeded ~1,300 ha (the outline in the image is ~1,600 ha, but is larger than the apparent burnt area).
Initial overestimates were likely due to problems with estimating burnt area from hotspots alone, which was all we had yesterday. These can often be misplaced due to terrain & atmospheric effects. In this case, some hotspots were beyond the apparent burnt area, particularly MODIS
Probably a testament to the efforts on the ground that this fire didn't spread much further. Monumental effort given the length of the headfire. @fire_scot
@fire_scot Here's a useful comparison of yesterday's midday imagery with today's 'extinguished' burnt area estimate, showing the acceleration of the fire to the south, almost doubling in size yesterday afternoon.
My final estimates are:
Burnt area 1,300 ha (13 sq km)
21 km perimeter
• • •
Missing some Tweet in this thread? You can try to
force a refresh
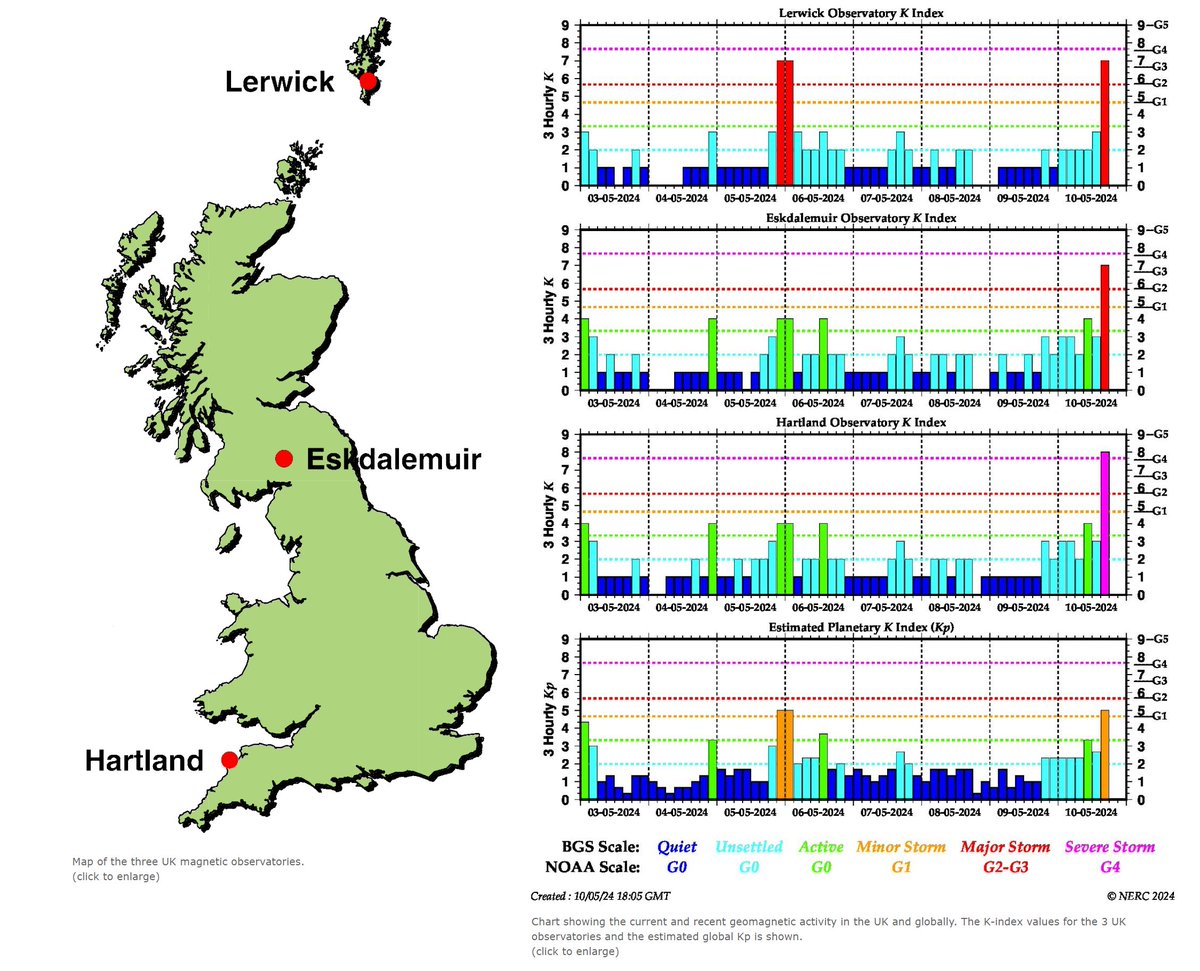
UK friends & others in northerly latitudes: I highly recommend going somewhere dark tonight.
This is the strongest solar storm in 20 years.
There are clear skies for most of the UK.
A once-in-a-lifetime opportunity to see #aurora for many.
[1/6] Want to know more... Read on
This animation shows *SIX* coronal mass ejections from the sun. All of which on a trajectory for Earth. The sun (the white circle in the centre) is blocked out to protect the sensor. The two bright spots are Jupiter (left) & Venus (right).
[2/5]
The solar flares are emanating from this gigantic sunspot (AR3664)... For scale, the sunspot is 15-Earths wide.
[3/6]
Spring is always beautiful... especially in infrared!
This photo was taken with a camera I converted to be sensitive to IR wavelengths of light that plants reflect in abundance when they're healthy. We see green, but that's a small fraction of the light reflected by plants.
[1/x]
The sensors on digital cameras are made of materials that are sensitive to visible light that an unimpaired human eye can see, but also infrared wavelengths beyond that sensitivity. Camera manufacturers install a filter to block that unwanted light, but you can remove it.
[2/x]
The clearer the sky, the darker it looks. The camera only picks up IR light, which is far away from blue visible light in the electromagnetic spectrum. You can see the half-Moon in this shot. It would have been hard to see with the naked eye, shrouded by a bright blue sky.
[3/x]
I've said it before and I'll say it again:
"This is a *huge* amount of extra energy being transferred to the atmosphere. Expect extreme temperatures and storm records (again). Just the top few metres of our oceans store as much energy as the entirety of our atmosphere."
[1/3]
This really is urgent. Action is needed *NOW* & it needs to be of Manhattan Project/Landing on the Moon speed & scale.
Earth's energy balance is out of kilter:
During 2020-23, Earth accumulated ~68 zettajoules (ZJ) of energy.
During 2007-10, Earth accumulated ~28 ZJ.
The extra energy gained by Earth in the past three years is similar to the amount gained between 1970 & 1985.
[1/5]
Why is the energy imbalance growing?
- emissions from fossil fuels lead to an enhanced greenhouse effect, reducing how efficiently Earth loses heat to space
- at the same time we're improving air quality, which reduces the cooling effect of aerosols that reflect sunlight
[2/5]
Shipping fuels were heavily regulated recently. They produce reflective aerosols & are also known to increase cloud cover, shading the oceans.
Between 2015-20 & 2020-23, the absorbed solar radiation anomaly tripled in the North Atlantic, the North Pacific is up by 70%.
[3/5]
How did historic climate events inspire vampire mythology, Shelley's Frankenstein, Turner's famous sunsets, & even Stradivari's violin craftmanship?
Here's a short thread on these climate-artistic connections that span literature, paintings, and music.
[1/n]
Before the dominance of fossil fuel greenhouse gases as the main driver of climate change in the past century, noticeable decadal-scale change was generally a function of volcanic activity (episodic cooling) & solar activity (inactive periods linked to regional cooling).
[2/n]
The 'Year Without a Summer' is perhaps the most famous example. The 1815 explosive eruption of Tambora (Indonesia) led to a year-long 'volcanic winter' with famines from China to Europe. The European summer of 1816 was particularly cool.
[3/n]
- Domestic solid fuel burning is now the largest source of UK particulate pollution, overtaking traffic
- Government monitoring networks are not designed for static suburban pollution sources
- Citizen science is filling the gaps
Low-cost and reliable sensors are enabling communities to set up their own monitoring networks to raise awareness of pollution hotspots that are missed by national or local authority air quality monitoring: