This is a fantastic ICT thread that goes over internal liquidity and how to use it to participate in higher probability setups 💎
Read carefully #ICT
Read carefully #ICT
To start off, to recap, there are two types of liquidity, external and internal.
External are liquidity points outside the range, and it’s all subjective to the time frame you look at
External are liquidity points outside the range, and it’s all subjective to the time frame you look at
This means, if you are on a weekly timeframe and are looking at lower time frames, an example of external liquidity would be something like the weekly high and low.
Internal liquidity would be like the daily high or low or anything in between the external liquidity like this:
Internal liquidity would be like the daily high or low or anything in between the external liquidity like this:

So now that you know what that is, I will be going over how to use internal liquidity to find higher probability setups.
So, because this one has not hit sellside, I would definitely give this like a 4 or 5, because even though we have nice displacement to the upside, we did not hit sellside
Ok, NOW look at the same setup, what would you rate this 1-10 (this setup isn’t done yet, just wait and you will see my point) 

This setup is definitely much better since we purged liquidity, which I would probably rate about an 8, keep in mind this setup is more subjective to rating depending on your model and screen time
This setup is DEFINITELY a 9, if not a 10 for me, but why did a few candles change this? Well, we know we hit external liquidity in the last two setups, but what was the overall difference?
The overall difference is at first, we see, ok yeah it’s a decent setup with nice displcament and a nice FVG long, but after being a bit more patient, the market starts to actually BUILD / ENGINEER more internal liquidity
This is important because depending on the day, I probably wouldn’t have taken the second setup, but after those few candle sticks that form and engineer that internal buyside, a siren goes off in my head and changes my mind because now the market is giving us MORE than what it
gave us at first, telling us that we NOW have more of a liquidity pool to run through unlike before, so I would be more interested in the setup where it looks like liquidity was engineered rather than gambling on the fact that the market will go towards 1 high
So one thing to note is I bet the second setup still would’ve worked, but if you want HIGH HIGH probability, the third setup is a little better, and here’s why:
Based off my risk management strategy, if I think the external buyside will hit, I always look for a solid internal buyside target to hit first so at least I get a free trade out of it or some partials taken (these are typically scalper types of trades)
Once the internal liquidity hits, I move my stop to BE or if it’s a choppy day / slow day I’ll typically take some profits there just in case. This definitely depends on the conditions of the day and the overnight range as well
Let’s say Asia high and low from overnight are already swept and it is seek and destroy conditions, then yeah I am not holding a full position until buyside which is why it’s important to look for nice engineered internal buyside to give us more of a boost:)
This allows me to have one confident target (the engineered internal liquidity) and leaving me the opportunity to possibly hold for a little longer.
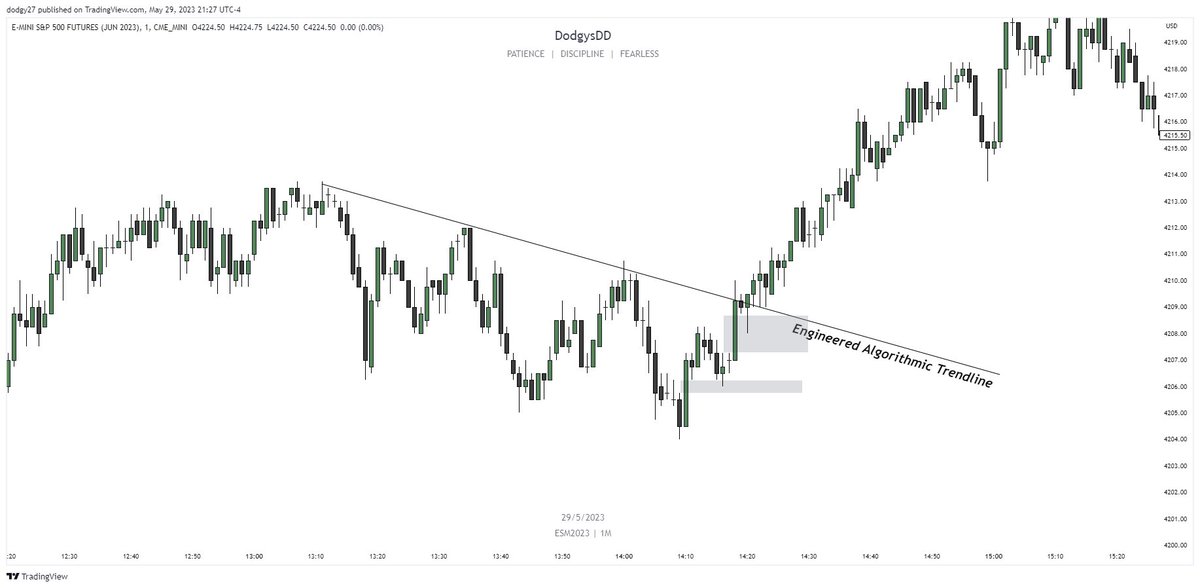
You can also use this with trendline liquidity, I’ll be more willing to long an FVG if a trendline builds up (even with no MSS) rather than longing a FVG with no algorithmic LRLR forming 

Hopefully this thread helps, I know it will and take the time to backtest this and the difference of probability of setups when we build up internal liquidity versus you just gambling on a single high to be hit
Discord is here with lots of free education discord.gg/WdB42YgyFu
Free sunday night classes as well, and occasional free live streams of trading
Free sunday night classes as well, and occasional free live streams of trading
• • •
Missing some Tweet in this thread? You can try to
force a refresh

 Read on Twitter


