Prometheus Research Profile picture
Jun 1 14 tweets 4 min read Twitter logo Read on Twitter
Disinflation requires a Recession, but we are not there yet 🧵

1. Economic #cycles generally follow cause-and-effect templates, and this cycle has followed the archetype, albeit with its unique twists.
2. As an economic expansion ages, the ability for output to accelerate begins to stall as the economy runs up on capacity constraints in the form of production and labor limitations.
3. However, if nominal growth remains strong relative to debt service burdens, credit and income can support employment and production to remain faster than population growth and production capacity.
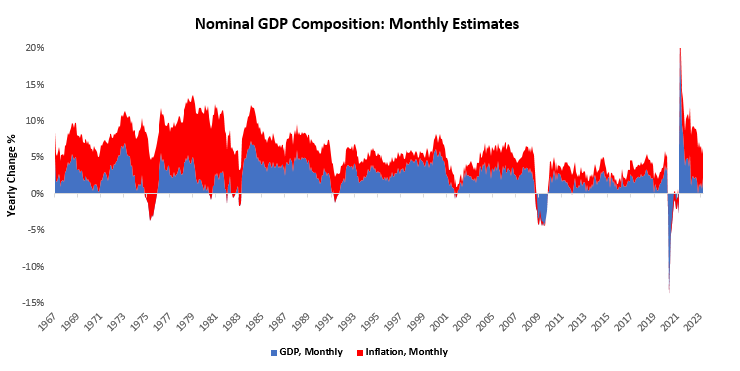
4. The confluence of these factors creates tightness in economic capacity, which fuels inflation. Below, we show periods when these forces have come together to fuel inflation: Image
5. This tight economic capacity can usually only be loosened through a recession by reducing production, employment, and nominal spending. Below, we show how sustained declines in a combined measure of employment, production, and nominal spending facilitate disinflation: Image
6. While there are periods when inflation has slowed outside of a recession, the largest decelerations in inflation occur during recessions, i.e., when real economic activity across the economy contracts.
7. This contraction in output brings down spending, which brings nominal spending more in line with the economy's output capacity. Below, we highlight periods where recessionary conditions have facilitated disinflation: Image
8. Above, we use our estimates of recessionary pressures, which consider changes in real business sales, production, employment, and unemployment, to categorize periods of disinflation
9. This approach is identical to using NBER recession dates but offers the advantage of being available in real-time and avoids the discretion involved in the NBER's recession dating committee. Below, we show the weighted average of these recession indicators: Image
10. Recessions are a broad-based decline in activity, which include persistent declines in production, real spending, and employment. Therefore, it is not just the magnitude of the decline in the weighted average of these indicators that matters but also the breadth.
11. Today, production and business sales have begun to soften, but labor market data remains robust. Below, we show how the labor market remains extremely tight relative to measures of sustainable unemployment (NAIRU). Image
12. Additionally, we complement the picture above by highlighting periods when our systems guage that economic conditions were tight. As we can see, unemployment continues to be extremely low.
13. Further, capacity utilization and nominal GDP relative to debt service burdens both remain elevated. As it can be seen below, capacity utilization has slowed modestly; however, they remain supported by extremely high levels of nominal spending. Image
14. Overall, the constellation of these factors suggest that conditions are still inflationary and with employment gains keeping the consumer resilient, the inflationary pressures remain entrenched.

• • •

Missing some Tweet in this thread? You can try to force a refresh
 

Keep Current with Prometheus Research

Prometheus Research Profile picture

Stay in touch and get notified when new unrolls are available from this author!

Read all threads

This Thread may be Removed Anytime!

PDF

Twitter may remove this content at anytime! Save it as PDF for later use!

Try unrolling a thread yourself!

how to unroll video
  1. Follow @ThreadReaderApp to mention us!

  2. From a Twitter thread mention us with a keyword "unroll"
@threadreaderapp unroll

Practice here first or read more on our help page!

More from @prometheusmacro

Jun 2
Dissecting CPI 🧵👇

1. While over 300 line items drive CPI that we have visibility into, we can condense these measures into four broad categories that account for the bulk of the variations: food, energy, transportation, and shelter. We show this composition below: Image
2. Both economically and statistically, these categories explain about 85% of the monthly variation in CPI. Therefore, we think it makes sense to approach our dissection of CPI by evaluating these areas.
3. We believe that food & energy prices can continue to contribute to a softening in CPI, but the swing factor will likely be transportation inflation. So far this cycle, transportation has been a net support to the disinflation we expected over the year. Image
Read 26 tweets
Jun 1
Resilient US Consumer 🧵

1. In April, households saw incomes increase as employment and inflation contributed to nominal incomes. Alongside this increase in employment income, we also saw continued support from income on assets total incomes. Below we show the composition: Image
2. Personal income increased by 0.36% in April, disappointing consensus expectations of 0.4%. This print contributed to a sequential deceleration in the quarterly trend relative to the yearly trend.
3. The primary drivers of this print were Employee Compensation (0.6%) & Income on Assets (0.25%). Over the last year, Employee Compensation (3.36%), Rental Income (0.5%), & Income on Assets (0.96%). have been the primary sources of the 5.43% growth in income.
Read 18 tweets
May 31
1. Through April, our systems place Real GDP growth at 1.37% versus one year prior. Below, we show our monthly estimates of Real GDP relative to the official data: Image
2. Below, we show the weighted contributions to the most recent one-month change in real GDP, along with the recent history of month-on-month GDP. Additionally, we show the contribution by sector to monthly GDP in the table below. Image
3. April saw an improvement in investment activity, contributing significantly to GDP data. Combined with our inflation estimates, this place nominal GDP at 5.31% versus one year prior: Image
Read 9 tweets
May 31
🧵 Our Thoughts On $SPY :

1. Over May, the S&P 500 rose 0.87%, primarily driven by valuations. Earnings expectations & valuations contributed 0.13% & 0.74% to the 0.87% rise in markets. Below, we show the sequential evolution of market prices, along a decomposition: Image
2. Over the last year, the S&P 500 has been dominantly driven by valuations, with total returns rising by 1.03%. We show cumulative returns on the S&P 500 over the last year, decomposed into earnings expectations and valuations: Image
3. We further decompose these yearly returns into their sector contributions. We begin by showing the primary drivers of the S&P 500. We show the top three drivers in blue (Technology, Financials, Industrials) & the bottom three in red (Consumer Disc., Healthcare, Energy): Image
Read 14 tweets
May 31
Weekly Recap

Do not worry in case you missed out on any action from @prometheusmacro last week. Below we pen down all the key takeaways & opinion threads that were shared with the wider community. Make sure to #SubscribeToday so that you don't miss any of the updates.
1. We introduced the 'Prometheus Daily Trend Signals' to share the latest trend updates for all 37 ETFs across four asset classes daily.

2. Next, we presented a first glimpse of the Cyclical Rotation Strategy for Equities.

Read 9 tweets
May 30
On Wages, Profits & Interest Expense

1. The current macroeconomic picture remains where heightened nominal demand continues to press against the economy's capacity constraints, creating heightened inflation. Image
2. We think these dynamics will
likely be resolved through the Fed's tightening cycle by raising interest burdens in the economy relative to incomes, creating pressure on profitability for companies, and leading to an eventual lay-off of
workers.
3. Therefore, the key to understanding whether the Fed's hiking cycle has been adequate is
whether profits will contract. This profit contraction will likely come from declining topline, sticky wages, and increasing debt service costs.
Read 8 tweets

Did Thread Reader help you today?

Support us! We are indie developers!


This site is made by just two indie developers on a laptop doing marketing, support and development! Read more about the story.

Become a Premium Member ($3/month or $30/year) and get exclusive features!

Become Premium

Don't want to be a Premium member but still want to support us?

Make a small donation by buying us coffee ($5) or help with server cost ($10)

Donate via Paypal

Or Donate anonymously using crypto!

Ethereum

0xfe58350B80634f60Fa6Dc149a72b4DFbc17D341E copy

Bitcoin

3ATGMxNzCUFzxpMCHL5sWSt4DVtS8UqXpi copy

Thank you for your support!

Follow Us on Twitter!

:(