QPR Analytics Profile picture
Jun 2 8 tweets 4 min read Twitter logo Read on Twitter
1/ Moving to more equitable Championship:

Squad market values (as measured by @TMuk_news) are a useful proxy to measure the value of football squads, in the absence of reliable current wage bill data.

Looking at this data can provide insight into how ‘equal’ the division is… Image
2/ …is at any given point in time. Putting this data, for the past 8 @SkyBetChamp seasons, into a box & whisker plot (below) shows the distribution of ‘wealth’. This type of chart shows how wide that distribution has been (esp. 20/21) but that it’s slightly calmed down since… Image
3/ …the highs of 20/21. This data can also be used to show the ‘skew’ of squad values across the division, for each season.

Again, this has decreased (slightly) since the high point of the pandemic, which helped create a ridiculously inequitable league…

#SkyBetChampionship Image
4/ Squad market values (as they are at close of each summer transfer window) are reasonably correlated with the amount of points ultimately won in a season.

This is expressed on the below chart as points per game (with points deductions not applied).

So we’d expect to see… Image
5/ …highly skewed division to be fairly well-correlated with being easier to predict.

This is largely true if we look at the last 8 @SkyBetChamp seasons, although the 22/23 season was a slight outlier; it was still fairly skewed but less easy to predict based on squad values. Image
6/ Finally, returning to the earlier chart, it’s clear that the huge inequity brought on by Covid, and the gumming up of the transfer market, has subsided somewhat.

Consequently the division has become slightly more equitable in terms of squad values…

#SkyBetChampionship Image
7/ Given the strength of the teams coming down from the Premier League in 23/24, I’ll be fascinated to see how this looks as of the end of the summer transfer window this year.

I’ll be even more interested to see where #QPR fit in terms of our own squad value vs others

• • •

Missing some Tweet in this thread? You can try to force a refresh
 

Keep Current with QPR Analytics

QPR Analytics Profile picture

Stay in touch and get notified when new unrolls are available from this author!

Read all threads

This Thread may be Removed Anytime!

PDF

Twitter may remove this content at anytime! Save it as PDF for later use!

Try unrolling a thread yourself!

how to unroll video
  1. Follow @ThreadReaderApp to mention us!

  2. From a Twitter thread mention us with a keyword "unroll"
@threadreaderapp unroll

Practice here first or read more on our help page!

More from @AnalyticsQpr

Jun 26, 2022
Predicting outcomes for the upcoming @SkyBetChamp season: there are few better indicators, as to where a team will roughly finish in the table, than wage bills. With a correlation of 0.54 (between wages & points), no other variable (on its own) has a stronger relationship…
…with points won in any given season. However, we obviously can’t model an upcoming season based on wages as we have no idea what these are. Instead, I use @Transfermarkt ‘market values’ as a proxy for wages. The correlation between these and points is 0.49, so not much…
…different to wages. And whilst these market values can be debated (Jeff Hendrick at £6.5m for example), they broadly stand up in gauging how strong any given @SkyBetChamp team is. Of course there are numerous other variables which determine where a team ‘should’ be finishing…
Read 6 tweets
Apr 29, 2022
QPR’s 10-match rolling xG & xGA since Mark Warburton arrived in 2019. The blue shaded areas show the periods where the xG was above the xGA, i.e when #QPR were good. It’s hard to overstate how volatile last season was, and it’s no surprise that we went into this season with…
…elevated expectations. ‘Playoffs’ was a word used by many prior to a ball being kicked last summer. In that sense it’s not massive a shock that, having fallen short this year (and badly so), a change has been made. #QPR currently sit in 17th based on xG Difference (xG - xGA)
Whenever I’ve talked about #QPR ‘overachieving’ this season it’s always been based on these xG numbers. It’s not based on whether this squad is good enough (or capitalised enough) to achieve a top 6 place. I, like many others, believed that was a realistic aim this season
Read 7 tweets
Mar 27, 2022
The value of possession (or otherwise). The chart below shows the rate of chances created vs average possession, so far in this season’s @SkyBetChamp. Top left corner is reserved for the true ‘wasters’ of possession. @QPR are nowhere near @SwansOfficial levels, but of the… #QPR Image
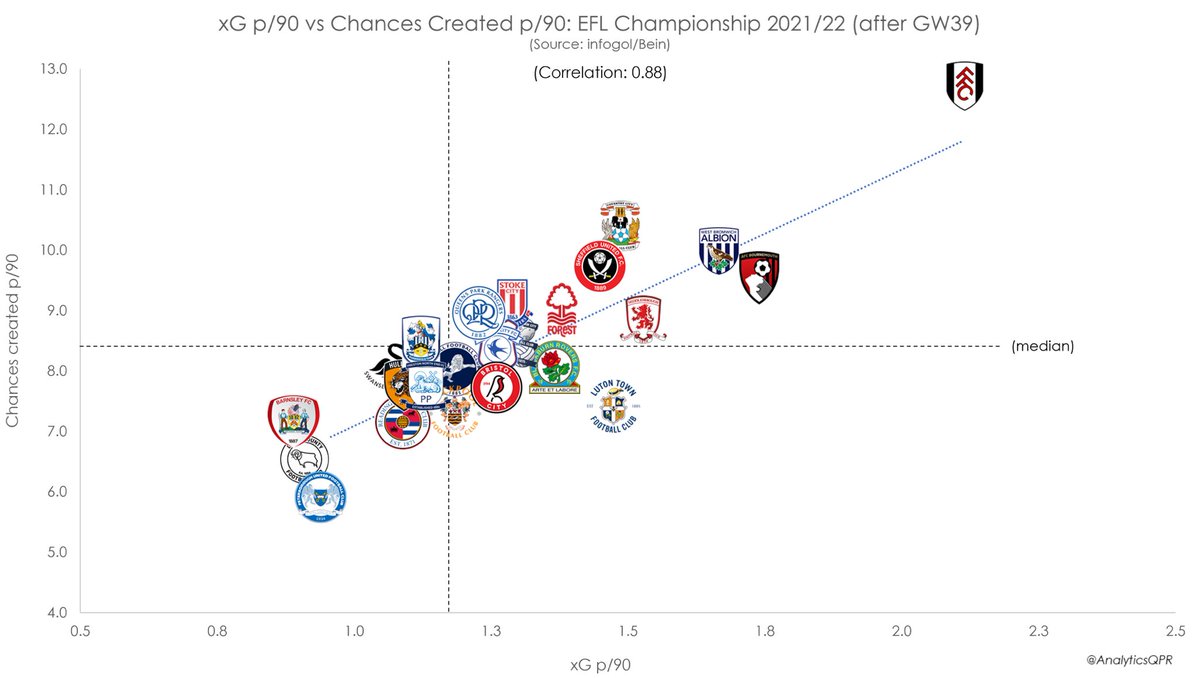
…other high-possession teams, they are a little more pedestrian in terms of chances created. Chart below shows rates of chances created vs xG (there’s obviously a very strong correlation here). Another chart distorted by @FulhamFC, so let’s illustrate in another way… #QPR Image
The table below is ranked by the rate of chances created. The xG is colour-coded which makes it easier to show who’s over/under performing. @QPR on the low side of xG based on their rate of chances created, so the inference would be that we’re not creating ‘good’ chances… #QPR Image
Read 7 tweets
Apr 29, 2021
1/ With the playoff teams confirmed for this season, I wanted to look at how many points @QPR need to be targeting in order to break into the top 6 next season... #EFL #QPR
2/ Taking data from the last 5 @SkyBetChamp seasons (including this season, with points per game used to account for 46 matches), we can use logistic regression to determine the probability of finishing in the top 6, based on number of points won... #QPR #EFL
3/ The chart below illustrates this relationship between points and probability of top 6, i.e. if a team achieves 80 points (for example), then they’re almost certain to finish in the top 6. A team will likely need to achieve somewhere around 73 points to give themselves... #QPR
Read 5 tweets
Apr 9, 2021
1/ Fancied illustrating how much @QPR have improved in the second half of the season, and in context to the rest of the @SkyBetChamp division. The chart below shows the difference in average goals scored per match between Matches 1-23 & Match 24 onwards... #EFL #QPR
2/ Goals scored per match increased from 0.96 to 1.31. Goals conceded per match (chart below) improved from 1.30 down to 1.00 between those periods. Both charts illustrate that @QPR are one of the most improved teams in the second half of the season... #EFL #QPR
3/ Obviously #QPR still have 7 games to play and things can change between now and the end of the season, but it’s a nice illustration of the improvement nonetheless #EFL @SkyBetChamp
Read 4 tweets
Mar 9, 2021
Any reason to be nervous tonight? Shouldn’t be, given that @wwfcofficial are by some distance the worst team in the division. However there’s a sense that this is the sort of team we tend to struggle against... #QPR #QPRWYC
As of Week 35, @wwfcofficial have only scored 23 goals (and 4 of those were penalties). However, 35% of this meagre total were from set-pieces, significantly above the league average of 24%. So if there’s any threat, it’ll likely be from these #QPR #QPRWYC
Despite a massive improvement in our defending this season, @QPR still ship a decent share of goals from set pieces. But, is this enough to make anyone nervous? Against the worst team in the division? #QPR #QPRWYC
Read 7 tweets

Did Thread Reader help you today?

Support us! We are indie developers!


This site is made by just two indie developers on a laptop doing marketing, support and development! Read more about the story.

Become a Premium Member ($3/month or $30/year) and get exclusive features!

Become Premium

Don't want to be a Premium member but still want to support us?

Make a small donation by buying us coffee ($5) or help with server cost ($10)

Donate via Paypal

Or Donate anonymously using crypto!

Ethereum

0xfe58350B80634f60Fa6Dc149a72b4DFbc17D341E copy

Bitcoin

3ATGMxNzCUFzxpMCHL5sWSt4DVtS8UqXpi copy

Thank you for your support!

Follow Us on Twitter!

:(