Andy Constan Profile picture
Jun 2, 2023 20 tweets 6 min read Read on X
Did volatility go up or down today? 101. Easy question? Not really. I will keep it as simple as possible. There are many great vol guys to give a better answer on here, But here goes. The symbol most use for vol is $VIX Image
$VIX fell a lot and made a new year low. It also made a post COVID low Image
Don't use $VIX. Never use VIX. It is not tradable and on Friday's it is always pressed down more than it "should" be and always pressed up more than it "should" be on Monday. Use front month VIX Futures. This sub thread explains it.
Okay so use VIX futures. Let's use the most liquid front month symbol $VXMM23 Bloomberg code UX1. It fell too but hasn't yet made a new low. Image
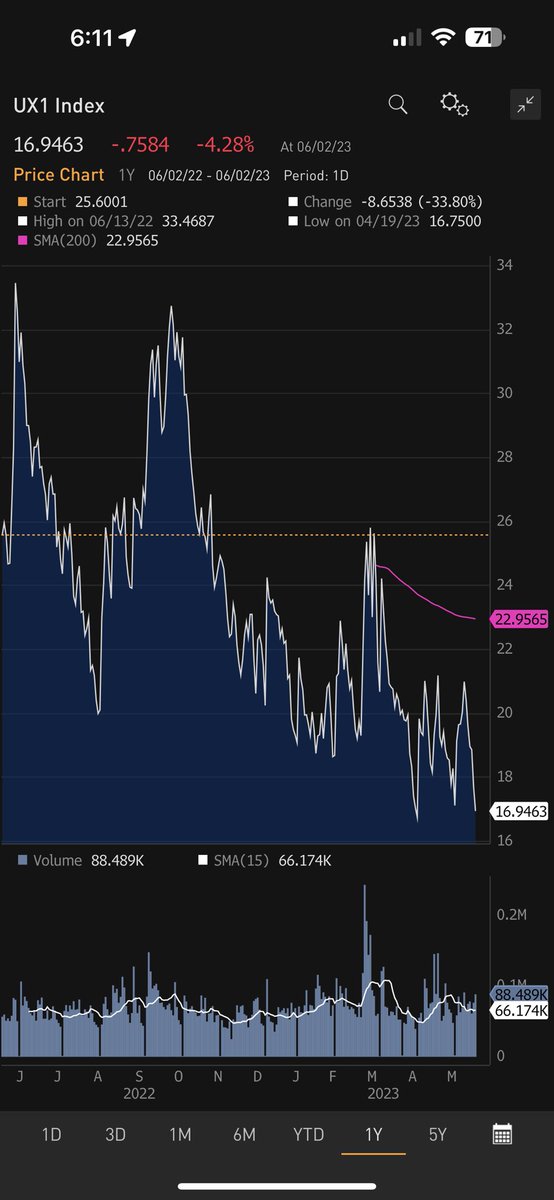
So we're done right. VIX Futures fell vol was down today. Not so fast. Whenever the market rises VIX and VIX futures fall with high correlation of 72% Image
Why is that? Well you might think it's because in a rally people sell their hedges and markets are more confident and all sorts of other fundamental reasons. But mostly it's just mechanical. Stay with me because this is where the math comes in.
**Let's start by looking at the implied volatility of options with strikes ranging from 90% of Spot to 110%. Notice how the IV drops from the left to the middle bottoms around 102.5% and starts going up as you go right. This is an example of skew called a Smirk 😏 vs one you see Image
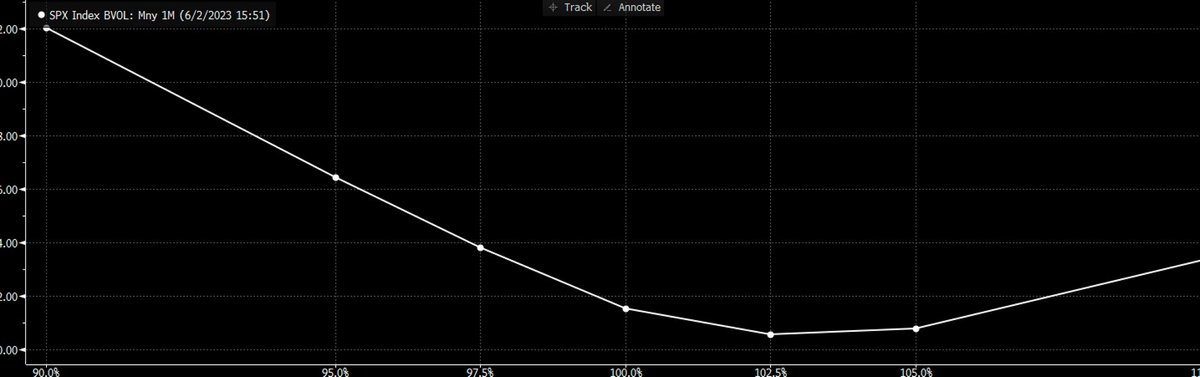
In other markets called a smile 😀 Risky assets tend to have a smirk. Anyway enough about emojis. Let's put a particular strike on a couple. Let's say the IV of 99 strike is 16 the IV of the 100% strike is 15.5 and the 101 is 15.
Now let's not use percentages and instead use actual strikes. The 4240 strike is the 99
4280 is the 100
4320 is the 101. Jeez we are close to the JHEQX collar. Anyhow. Let's assume the market rallied from 4240 to 4280 today.
What does VIX measure roughly. It measures the 100% strike IV.
Now let's think about market participants who traded the 4240 put which yesterday was at 16 IV. There was a buyer and a seller at the IV for that option. Similarly there was a buyer and seller of the 4280 at 15.5
Both sides of each strike have no particular reason to change their view on IV of the option they bought just because the market moved a paltry 1%. So the 4240 strike IV stays at 16 and the 4280 stays at 15.5. BUT wait the vix changed its reference strike from 4240 to 4280
It reports the ATM vol fell 50bp. But no actual options IV changed at all!!! All that happened is the reference atm vol rolled higher. The slope of that graph above is literally the mechanical reason that VIX Fell and the correlation between VIX and SPX is so strongly negative.
See. Just because VIX (or vix futures for that matter) fell does not mean vol fell.
Okay go back up to the ** tweet and do loop until you understand.

Okay you understand and are out of the infinite loop. Time to label this. It's called sticky strike vol. when you measure vol
Based on moneyness like 100% moneyness that VIX has you miss the skew effect. But you do get information to. For instance if a market moves up and VIX (Sticky moneyness) doesn't fall that's a big deal because it means vol has actually risen on specific strike options and
Market participants are making and losing money on vol. What happened in the last day to stick moneyness vol. The red line is yesterday the white is today. Looks like stick strike dominated and vol was essential mechanical lower for ATM Image
Of course it's way more complicated and the best participants keep strike IV changes to see if vol is rising or falling. But you at home can plot this very roughly. The correlation of VIX to SPX changes is 72%.
Regressing VIX changes to SPX changes with a long history gives a coefficient of -4.6. That means a 1% change in SPX price roughly means a -4.6% change in VIX level. Now that coefficient depends on the skew today. A better way would be to look at the vol of the 99/101
And you can tell what VIX should read if we move up or down 1% the after the day is over you can see if the vix was up or down after correcting for rolling up or down the skew.

Then and only then can you come close to answering the question. FWIW vol was up today!
When my friends @Jimmyjude13 or @jam_croissant talk about market up vol up and you see vix down now you know what they are talking about.
BTW the correlation of Weekly and Monthly Vix Changes vs SPX changes is 70 and 69 respectively
This is partly just the simple fact that smirk is consistently part of options pricing. Do people who buy Vix Options know this?🤔 ImageImage

• • •

Missing some Tweet in this thread? You can try to force a refresh
 

Keep Current with Andy Constan

Andy Constan Profile picture

Stay in touch and get notified when new unrolls are available from this author!

Read all threads

This Thread may be Removed Anytime!

PDF

Twitter may remove this content at anytime! Save it as PDF for later use!

Try unrolling a thread yourself!

how to unroll video
  1. Follow @ThreadReaderApp to mention us!

  2. From a Twitter thread mention us with a keyword "unroll"
@threadreaderapp unroll

Practice here first or read more on our help page!

More from @dampedspring

Jul 7
Why do investment mandates exist and what dynamics exist because of them 101.

Benchmarks are a formal version of an investment mandate but I am talking about the broad topic of investment mandates.

I don't think it's controversial but I may be wrong but I think
an investment mandate serves a high purpose. An investment mandate allows an end investor to have a reasonable expectation of the risk and reward of the portfolio and its likely correlation to narrow and broader factors.

As many end investors allocate to many investments
They depend on a PM staying within their mandate. For instance an end investor may have an equity fund allocation and a BTC allocation. They clearly like BTC and have allocated separately at their desired size confident that the equity PM would NOT allocate to BTC because
Read 14 tweets
Jun 25
AUM and returns for multi strategy funds 101. Because people struggle with my summing up of my alpha and beta returns instead of "using a weighted average" I thought it may be useful to help people understand how professional money management works.
My experience is from decades of personal first hand knowledge. At my own hedge fund, Bridgewater, Brevan Howard, and first hand knowledge from PM's and owners of multi strategy pod shops. At the end of the day what matters is the return on AUM. What real dollars are earned
on the capital invested. Thats where this 101 will end. But first I'll start with basic concept of return that are often confused by many, including people on this app, who have not sat in an end investor or hedge fund owner seat. What is the denominator for return calculations.
Read 26 tweets
Jun 12
Manage your future money or your spot money 101 You can't do both and sometimes (Japan) you can't do either. Bonds or Money Choose your fighter.

Since the Fed began tightening all G4 currencies have depreciated va hard money and a consumption basket. But future money (bonds) Image
Image
Are Trading in a range. Future money is being protected via issuance policy and CB reinvestment policies and QT taper. Yield curves ex Japan are pretty average steepness. Despite spot money losing purchasing power and store of value Image
Image
Image
In Japan decades of YCC even modestly being unwound is showing that sometimes you can't protect spot money or future money at all. For now the policymakers are protecting future money and the market is all in short spot money via
Read 6 tweets
Jun 9
Swap to floating 101.

How do issuers attempt to understand their financing costs relative to various alternatives and relative to competitors costs? How do investors determine the expected return of their investment choices? How do futures and options traders
Determine the appropriate risk free rate to determine the forward price of the underlying asset they are trading? Lastly how do global issuers, investors, and derivatives participants determine these things in their local currency.

The answer is they all swap to floating
What does that mean. We all know what a floating interest rate is. It's essentially the return on overnight cash (really 3 month sofr in the U.S.)
By swapping all investments back to overnight cash one can then compare the return in excess of cash
Read 23 tweets
May 17
There is no "Maturity Wall" 101.
Though this is a myth you may not be relieved by this thread.

Have you seen the doomer charts about the maturity wall of US Debt. It is a clear signal that you should unfollow those who post it. It usually starts with 9TN of debt comes due. Image
Notice the huge wall of debt maturities in the last chart. Sometimes the FURU posting the chart will do it monthly. Particularly when trying to suggest the Fed should cut rates to save the FURU's precious bags. Close to 6TN coming due in the next 3 months. OMIGOD PANIC! Image
Whats going on here? Well to put it simply the US has outstanding as of 4/30 6TN T bills. The distribution of these tbills looks like this. Notice while the graph above does not include it every month 4 week tbills mature and refinance and should be added to the next month. Image
Read 11 tweets
May 16
U.S. downgrade 101 comments

Firstly it is not a time to make extreme statements. Breathe people.

What happened?
Moody's lowered its credit rating of the U.S. joining S&P who moved in July of 2011 and Fitch in August of 2023 at a AA rating instead of the highest grade AAA 🧵
Here's how I'm thinking about it.

1. Is there any technical consequences for holders of the debt
2. What happened in markets when S&P and Fitch downgraded and what was happening with fiscal policy?
3. Will the downgrade and possible market moves impact the fiscal policy makers
The technical concern that many will doom about is that some holders are prohibited from holding debt that isn't rated AAA by at least one rating agency. Those holders could be forced sellers.

In reality what has happened in the past and what is almost certain to happen
Read 14 tweets

Did Thread Reader help you today?

Support us! We are indie developers!


This site is made by just two indie developers on a laptop doing marketing, support and development! Read more about the story.

Become a Premium Member ($3/month or $30/year) and get exclusive features!

Become Premium

Don't want to be a Premium member but still want to support us?

Make a small donation by buying us coffee ($5) or help with server cost ($10)

Donate via Paypal

Or Donate anonymously using crypto!

Ethereum

0xfe58350B80634f60Fa6Dc149a72b4DFbc17D341E copy

Bitcoin

3ATGMxNzCUFzxpMCHL5sWSt4DVtS8UqXpi copy

Thank you for your support!

Follow Us!

:(