1/ It's the weekend!
Grab a cup of coffee. In this thread, I will explain:
1. What is cost of capital and WACC?
2. How does a company's capital structure impact its valuations?
3. How to code WACC as a field in screener?
Let's dive right in.
Grab a cup of coffee. In this thread, I will explain:
1. What is cost of capital and WACC?
2. How does a company's capital structure impact its valuations?
3. How to code WACC as a field in screener?
Let's dive right in.

2/ Before we start to explore cost of capital, we first need to understand what is meant by capital structure of a company.

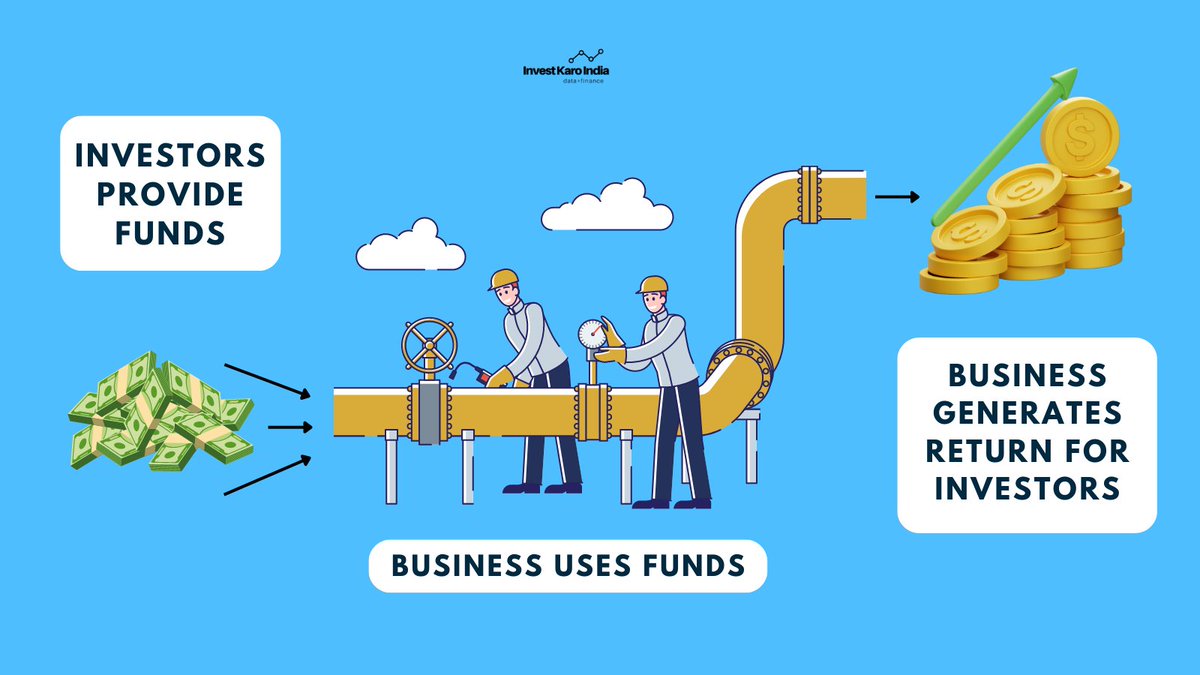
3/ Any business at a very simplified level, works in three steps
Step 1: Raise funds from various types of investors
Step 2: Use those funds to build projects that generate higher returns
Step 3: Deliver excess returns back to investors
Step 1: Raise funds from various types of investors
Step 2: Use those funds to build projects that generate higher returns
Step 3: Deliver excess returns back to investors
4/ In Step 1, when a business is raising funds from investors, it has a few options.
It can either raise funds from private sources (aka Private Equity and Venture Capital)
or
It can raise funds from public investors (aka IPO)
or
It can borrow funds from a bank (aka debt)
It can either raise funds from private sources (aka Private Equity and Venture Capital)
or
It can raise funds from public investors (aka IPO)
or
It can borrow funds from a bank (aka debt)
5/ Each of these type of investors (Private Equity, Venture Capital, Public Investors, Debt) have a very different risk profile and as such demand different levels of return.
6/ A business also has several financial instruments at its disposal for raising funds.
These include selling equity through preference shares, ordinary equity shares, convertible bonds, or plain debt.
These include selling equity through preference shares, ordinary equity shares, convertible bonds, or plain debt.

7/ Once a business has finished raising funds, they are recorded on the left side of the Balance Sheet, also known as "Liabilities" or "Sources of Funds".
The right side of the Balance Sheet, or "Assets", represents the application of these funds.
The right side of the Balance Sheet, or "Assets", represents the application of these funds.

8/ The mix (debt vs preference shares vs equity shares vs convertible bonds vs anything else) in which a business raises funds is known as its capital structure.
9/ The cost of capital is simply the average rate of return a business has to generate in order to pay for these sources of funds (or capital).
10/ Cost of capital has a direct relation to what kind of projects a company can undertake in order to generate return for its investors.

11/ A good capital allocation is where a company invests in those projects that have the ability to generate rate of return higher than cost of capital for the company.
12/ A high cost of capital will force a company to undertake only those projects that generate very high rates of return (an unrealistic target).
Where as, if a company has low cost of capital, it becomes easier to undertake and consider a wide variety of projects.
Where as, if a company has low cost of capital, it becomes easier to undertake and consider a wide variety of projects.
13/ For example, if the cost of capital for the company is 18%, it can only invest in those projects that have the ability to generate a return of 19% or higher - a tough task to achieve.
14/ A good business is one that can easily generate a return on its assets much higher than the cost of its capital (aka good capital allocation).
15/ Good companies devote considerable attention to their capital structure, aiming to optimize their cost of capital.
Consider Apple as an example – it is renowned for having one of the most efficient capital structures in the tech industry.
Consider Apple as an example – it is renowned for having one of the most efficient capital structures in the tech industry.

16/ At the bottom of the interest rate cycle (in last 10 years) Apple raised the maximum amount of debt at rates as low as 1.35%

17/ At the same time, Apple embarked upon a major share re-purchase program, there by reducing the number of issued shares and effectively reducing its overall cost of capital (cost of equity is always much higher than cost of debt).

18/ Now that we understand what is meant by Capital Structure and Cost of Capital, lets explore how to calculate cost of capital and use it in our investing process.
19/ A major method used to calculate cost of capital is known as Weighted Average Cost of Capital or WACC.
This is its formula (dont be frightened - its pretty simple once we understand the logic behind it).
This is its formula (dont be frightened - its pretty simple once we understand the logic behind it).

20/ Weighted Average Cost of Capital, as the name suggests, is the weighted average of the cost of various sources of capital in a business.

21/ This is what the parts of the formula means
wd = weight of debt
rd = cost of debt
1-t = adjust for tax rate
wp = weight of preference shares
rp = cost of preference shares
we = weight of equity shares
re = cost of equity
wd = weight of debt
rd = cost of debt
1-t = adjust for tax rate
wp = weight of preference shares
rp = cost of preference shares
we = weight of equity shares
re = cost of equity

22/ Each of these components like cost of debt and cost of equity have various methods to calculate which we will explore in some other thread at another time.
23/ So how does a company's capital structure impact its valuations?
24/ A company with a low cost of capital (efficient capital structure) and a higher return on assets is given a higher valuation multiple by investors
as that business has proven ability to allocate money efficiently.
as that business has proven ability to allocate money efficiently.
25/ Similarly, a company that is unable to generate return on its assets higher than its cost of capital is essentially eroding shareholder and investor wealth by poor allocation of capital - there by getting a lower valuation multiple.
26/ Interest rates also have a large role to play in cost of capital.
To help explain this concept with a simple example
Apple can no longer issue debt at 2% interest rates for 10 years when the yield of a US 10 year bond (risk free) is 3.6%.
To help explain this concept with a simple example
Apple can no longer issue debt at 2% interest rates for 10 years when the yield of a US 10 year bond (risk free) is 3.6%.

27/ So, for Apple to raise more debt, it needs to pay a higher interest rate than US Fed, there by increasing its cost of capital.
28/ Finally lets explore, how can you leverage the concept of WACC to screen for companies that are good capital allocators.
29/ On screener.in create a custom field & input the below formula
This is a crude way of calculating WACC, here we have assumed the cost of equity to be 15% (can be lower or higher for individual companies) & cost of debt as 10% (can be lower or higher in practice)
This is a crude way of calculating WACC, here we have assumed the cost of equity to be 15% (can be lower or higher for individual companies) & cost of debt as 10% (can be lower or higher in practice)

30/ This method of calculating WACC is close enough and can help us in screening companies that are able to generate return on assets higher than their cost of capital.
31/ Once the custom WACC field is created, on the screening page you can simply screen for companies where WACC is lower than 3 or 5 year average of Return on Assets

32/ This will return us about 351 results.

33/ I hope this thread, helped you understand the concept of cost of capital, WACC and how it can be leveraged to screen companies.
34/ If you're new here, I write a new thread every weekend, explaining an investing concept.
Here is a link to all my other threads
Here is a link to all my other threads
https://twitter.com/itsTarH/status/1401095938945425410
35/
Occasionally conduct value chain webinars for various industries, here is one for #RenewableEnergy sector 👇
Occasionally conduct value chain webinars for various industries, here is one for #RenewableEnergy sector 👇
https://twitter.com/i/status/1663883243060629504
36/ Also, publish deep dives into one Indian listed company every month. Join 18,000+ readers at blog.investkaroindia.in
37/ Please retweet, the first tweet in this thread.
Follow me @itsTarH for more.
Thank you for reading!
See you next weekend with a brand new thread.
Follow me @itsTarH for more.
Thank you for reading!
See you next weekend with a brand new thread.
https://twitter.com/itsTarH/status/1664867015579025408
38/ You can read the unrolled version of this thread here: typefully.com/itsTarH/msyD2oh
• • •
Missing some Tweet in this thread? You can try to
force a refresh