Jeff Berardelli Profile picture
Jun 6, 2023 10 tweets 4 min read Read on X
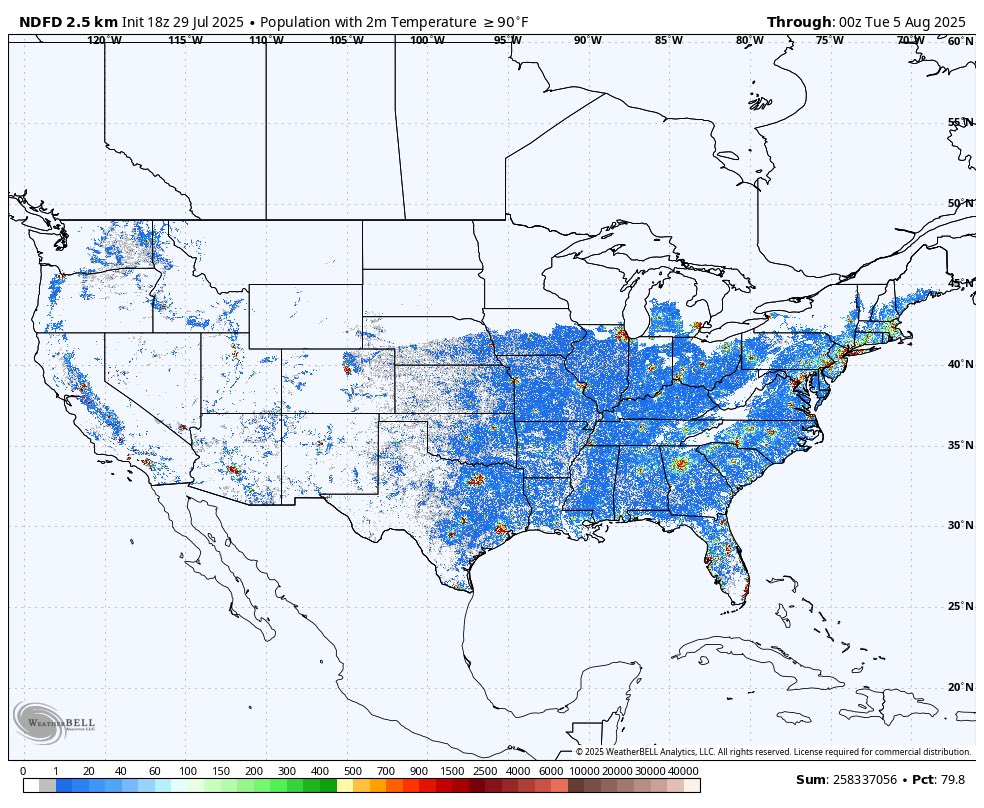
Life-threatening heat today in Puerto Rico so hot that some meteorologists are astonished. And more of the same to come this week. Heat index numbers as high as 115-125 today!! So what is going on? There are many factors, so let's dig in... thread 1/ Image
A pocket of Saharan dust is right over the island, leading to clear weather, helping boost temperatures. But there's a lot more.... Image
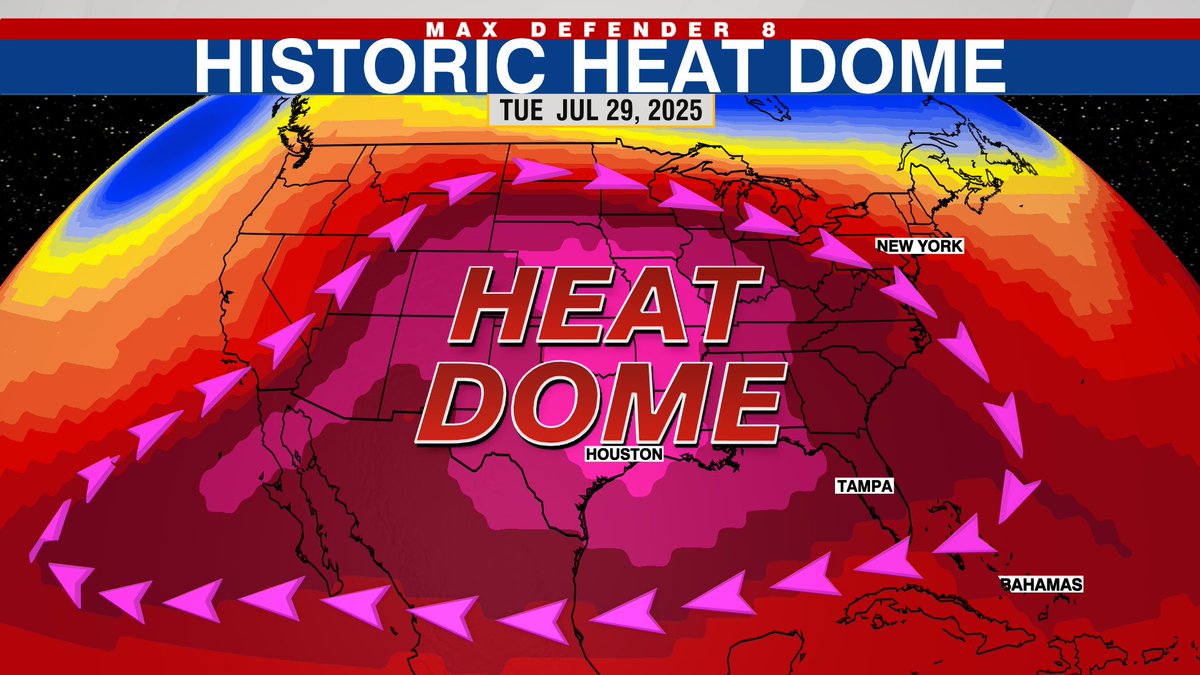
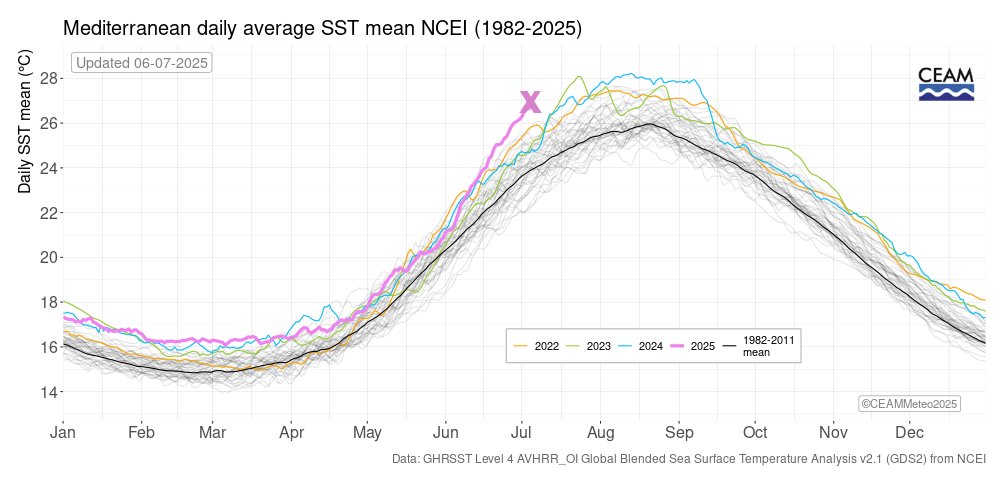
Zoom out and we see a culprit. A large/ intense high (heat dome) forming just east of Puerto Rico, unusually far south, leading to a SE flow and drawing up high humidity. But also record warm Tropical Atlantic water temperatures helping boost dewpoints... Image
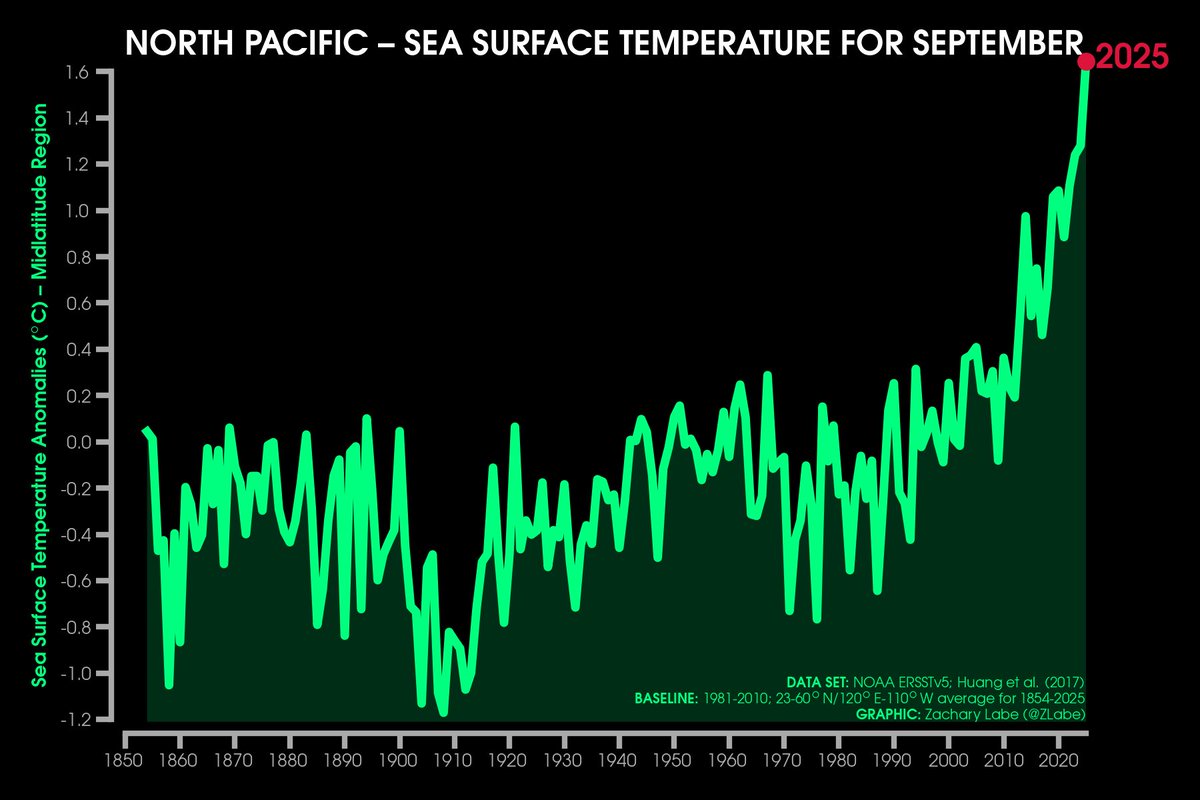
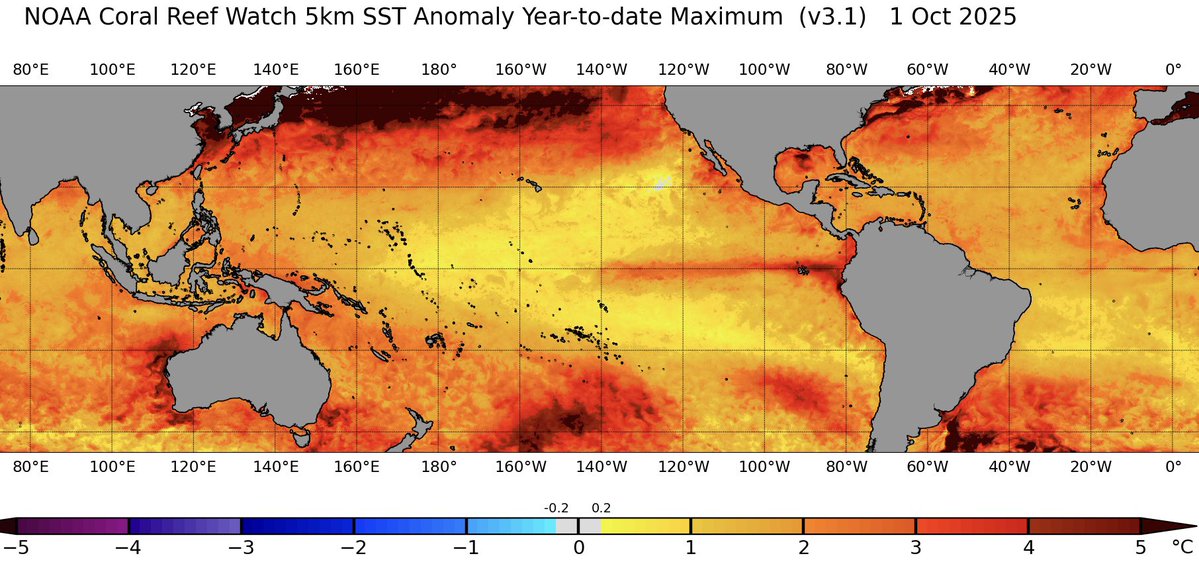
Yes the warm water is partially due to climate change, so it is a factor. Tropical ocean temps have warmed by ~2F. Also the natural distribution of "anomalously" warm water this year favors the tropics. Last summer it favored the North Atlantic... but there's more...
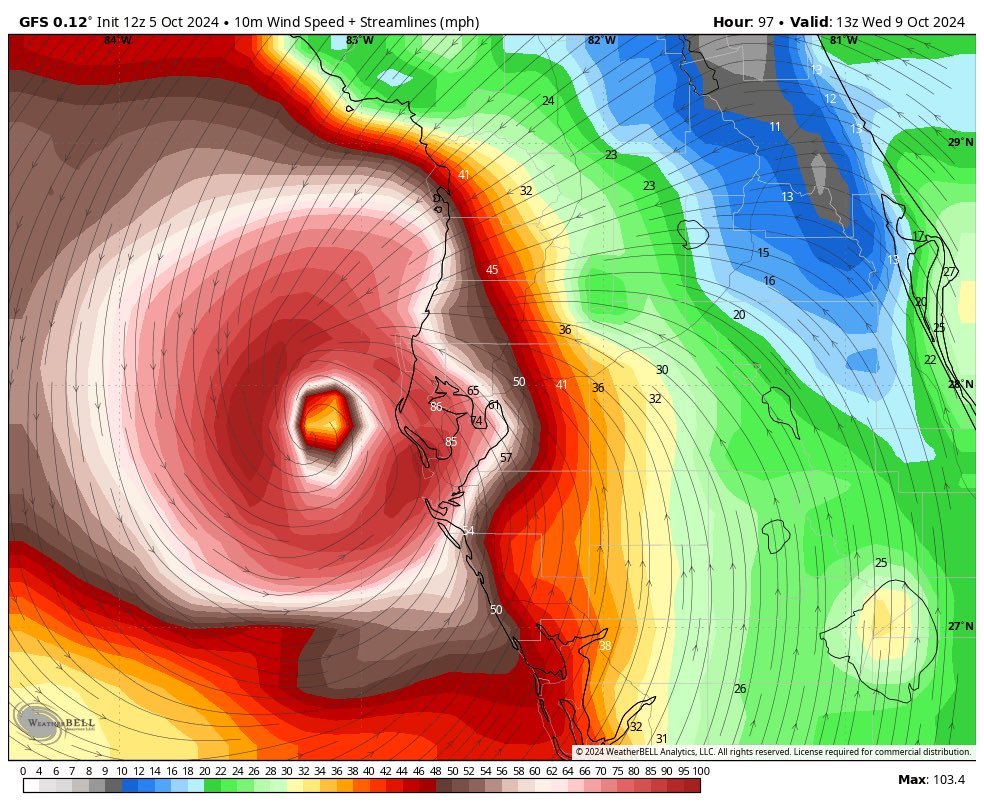
Now we arrive at the Wavy jet stream. The pattern right now is ludicrous in/ around North America. Blocky is an understatement. Some may be due to Typhoon Mawar's added wave breaking energy. But we are seeing these blocks more often especially during spring/ summer... Image
There's a lot of work being done to figure out the link between climate change, blocks and the wavy jet. The loss of sea ice and uneven heating at the poles is likely a factor in high latitude blocks. This leads to a very amplified pattern, big blocky lows and heat domes...
Next, we have a developing El Nino adding tons of energy to the mix. The subtropical jet is screaming, but that is more of a winter time phenomena than summertime for El Nino. With that said, when you overlay that on the prevailing pattern I can only surmise it amplifies...
The bottom line: As we go deeper into 2023 and El Nino intensifies, we should expect a stunning year of global extremes which boggle the meteorological mind. The base climate has heated due to greenhouse warming and a strong El Nino will push us to limits we have yet to observe.
@MichaelEMann did some work on Quasi Resonant Amplification. Summer is favored. But you'll have to ask him if this could be a case of that? science.org/doi/10.1126/sc…
@JFrancisClimate did the ground breaking work on the wavy jet stream. Again I'll let her chime in if she thinks this pattern resembles her research iopscience.iop.org/article/10.108…

• • •

Missing some Tweet in this thread? You can try to force a refresh
 

Keep Current with Jeff Berardelli

Jeff Berardelli Profile picture

Stay in touch and get notified when new unrolls are available from this author!

Read all threads

This Thread may be Removed Anytime!

PDF

Twitter may remove this content at anytime! Save it as PDF for later use!

Try unrolling a thread yourself!

how to unroll video
  1. Follow @ThreadReaderApp to mention us!

  2. From a Twitter thread mention us with a keyword "unroll"
@threadreaderapp unroll

Practice here first or read more on our help page!

More from @WeatherProf

Jul 29
I don't think you can understate just how impressive this heat dome is. It covers 2/3 of the nation in which 80% of the country's population over the 7 day heatwave period will hit 90+ for a high temperature (~260 million people)
The peak intensity of the heat dome was record breaking for the SE US in late July. It peaked at 3.7 standard deviations, based on statistics from the past climate records we have, which means this heat dome is rare, if not virtually impossible, in our former climate of the 1900s. But human-caused climate change now makes these extreme heat domes much more likely.
From the climate scientists at World Weather Attribution:
“Every heatwave in the world is now made stronger and more likely to happen because of human-caused climate change.”
A note: Its not the strongest heat dome I’ve seen and ground temperatures, although very hot, are not breaking many all-time records. The surface temps are not quite commensurate with the power of the heat dome aloft mainly due to the elevated low-level moisture from the Gulf.
Yes, as a climate specialist, I am very aware that climate change is not the only factor as to why it’s hot. I’m aware there is alot of asphalt making it hotter in cities. I’m aware it was record hot in the 1930s. I know the climate has always changed and the Earth goes through hot/ cold cycles. I know we are near sun spot maximum. I know all this, and more, because I have a Master’s degree in climate and I study this Every day. Thank you for coming to my Ted Talk.
A few sources for this post are in the thread below… #heatwave #heatdome @WFLAImage
Here’s the map showing that 280 million are impacted by 90 degrees plus. Image
And here’s what we can confidently say about the connection between climate and extreme weather from @WWAttribution

nam11.safelinks.protection.outlook.com/?url=https%3A%…
Read 4 tweets
Jul 9
What are the odds this July’s Mediterranean heat is natural?
About 1 in a billion!
It's the most extreme Mediterannean heatwave on record. Peak anomalies +8C (+14F) now off France/ Italy with absolute peak temps near 31C/88F.
Those are isolated, but how deviant are the overall Med SST's from the norm? Around 6 deviations (sigma) or a roughly a 1-in-a-billion chance. So, basically, it's NOT possible in a natural climate.
BUT heat waves like this are not caused solely by climate change. So let's dig deeper with a thread... 1/Image
First, let's establish the sigma. In June the standard deviation from the 20th century mean was about 5-6 in the Western Med and not quite as deviant in the eastern Med. This deviation built larger as the month unfolded and is peaking for now. 2/ Image
The pink line represents 2025. SST's are now "in their own league", already way above normal for the late summer peak. Heatewaves have increased by 3X since the 1980s, due to the increasing baseline from human-caused climate change. 3/ Image
Read 7 tweets
Oct 5, 2024
Alert: #Milton may threaten #TampaBay midweek.
I’m not an alarmist, it takes a lot to get my attention. This has it. If Milton landfalls at or just north of Tampa Bay as a cat 2-3 hurricane, it means up to double #Helene storm surge. And extensive, long term power outages 1/ Image
While the exact track/ intensity is to early to know, a hurricane traveling across the Gulf from the west/ WSW is a worst case scenario for, if it hits at or north of the mouth of Tampa Bay. The 1921 borderline Category 3 which hit Tarpon Springs pushed 10-12 ft of surge in 2/
If this still looks like a threat tomorrow, to whomever it still threatens, start taking actions. Top off hurricane supplies. Make/ discuss your family plans. Elevate your valuables if you are near the water. Prepare to evacuate if you are in an evacuation zone on Monday. 3/
Read 4 tweets
Sep 30, 2024
New: 2 rapid attribution studies on the impact of climate change on Hurricane #Helene have just been released. The results are very significant, yet unsurprising.
Warmer air, warmer water = much heavier rainfall rates. First study: ~50% increase in rain in parts of NC/ GA!! 🧵 Image
First from @MichaelFWehner, who is one of the World’s experts on the connection between climate warming and Tropical cyclones.
“…our best
estimate is that climate change caused over 50% more rainfall during Hurricane Helene in some
parts of Georgia and the Carolinas.” 2/ Image
@MichaelFWehner “Furthermore, we estimate that the observed rainfall was
made up to 20 times more likely in these areas because of global warming.”
That’s study number 1. Now let’s discuss study number two…
3/
Read 9 tweets
Jun 14, 2024
As you may suspect both the dewpoint in FL (surface moisture) and more importantly the precipitable water (total column moisture) in June have been trending up.
For every 1F increase in temperature, the column can hold 4% more moisture. We have warmed ~3F since pre-industrial 1/
Image
Wow now have the capacity for ~12% more moisture. Thus the capacity to fuel more frequent/intense rain. In some cases more moisture means more instability, thus stronger storms & rain rates. Per @MWehner2005 CC spiked Harvey by up to 38%, w/ CC's share of the damage $13B 2/ Image
@MWehner2005 The Gulf is record warm because: the baseline has been warmed by climate change - and- the historic heat dome over Mexico & the Gulf which made for hot/ cloud free weather. The Gulf is a big player in dewpoint and also rainfall rates, a likely contrubuter to FL's extreme rains 3/ Image
Read 4 tweets
Jun 7, 2024
25,000 years ago this is how Florida’s coastline looked. Sea level was 427 ft lower with all the water locked up in miles-thick ice at the peak of the last ice age. If you lived in Tampa you’d needed to walk 100 miles W to go to the beach. Follow along on this very educational🧵
Image
This is what it looked like at the last glacial maximum. Ice spread all the way down to NYC and Chicago. If you go to Central Park in NYC you can see the edge of where they ended, there are huge boulders there. These ice ages have occurred every ~100K years recently. Here’s why… Image
Earth’s tilt, orbit and wobble change on the order of 10s of 1000s of yrs. Milankovitch Cycles. This changes amount of solar radiation received and where the sunlight hits, gradually changing Earth’s avg temp over 1000s of years, leading to ice ages and warm periods. Here’s… Image
Read 8 tweets

Did Thread Reader help you today?

Support us! We are indie developers!


This site is made by just two indie developers on a laptop doing marketing, support and development! Read more about the story.

Become a Premium Member ($3/month or $30/year) and get exclusive features!

Become Premium

Don't want to be a Premium member but still want to support us?

Make a small donation by buying us coffee ($5) or help with server cost ($10)

Donate via Paypal

Or Donate anonymously using crypto!

Ethereum

0xfe58350B80634f60Fa6Dc149a72b4DFbc17D341E copy

Bitcoin

3ATGMxNzCUFzxpMCHL5sWSt4DVtS8UqXpi copy

Thank you for your support!

Follow Us!

:(