
WFLA-TV (Tampa Bay) Chief Meteorologist and Climate Specialist. BS Atmospheric Sciences Cornell U. MA Climate Columbia U. Past CBS News NY and Miami, Tampa, WPB
 H/T to @BhatiaKieran his post yesterday on Rapid Intensification
 Top right is how far “off the charts” September 2025 sea surface temps are in this area of the North Pacific. >1.6C or ~3F above normal on average over this huge area.
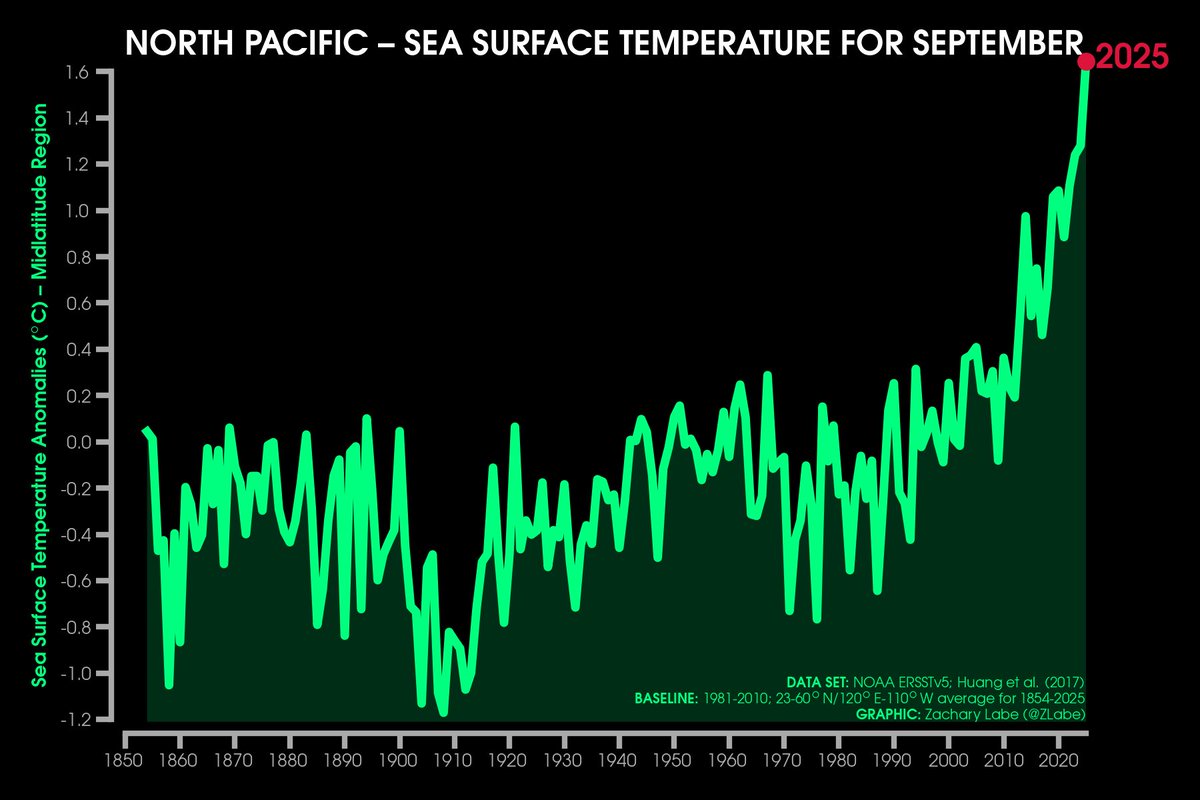
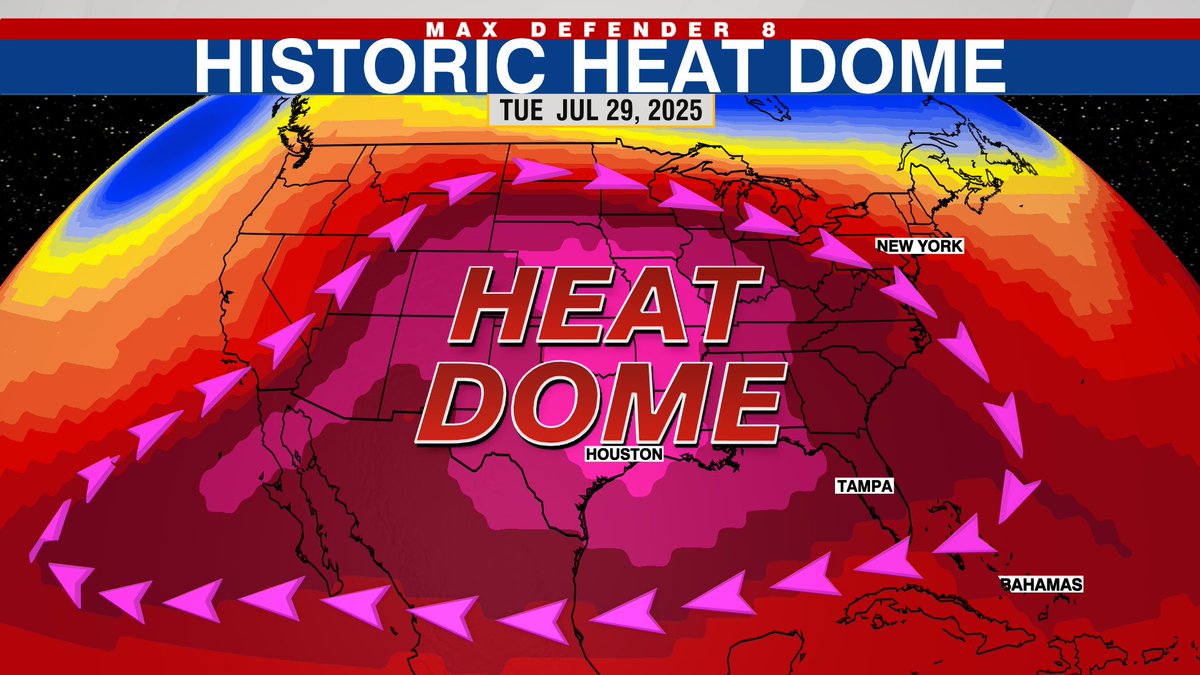 Here’s the map showing that 280 million are impacted by 90 degrees plus.
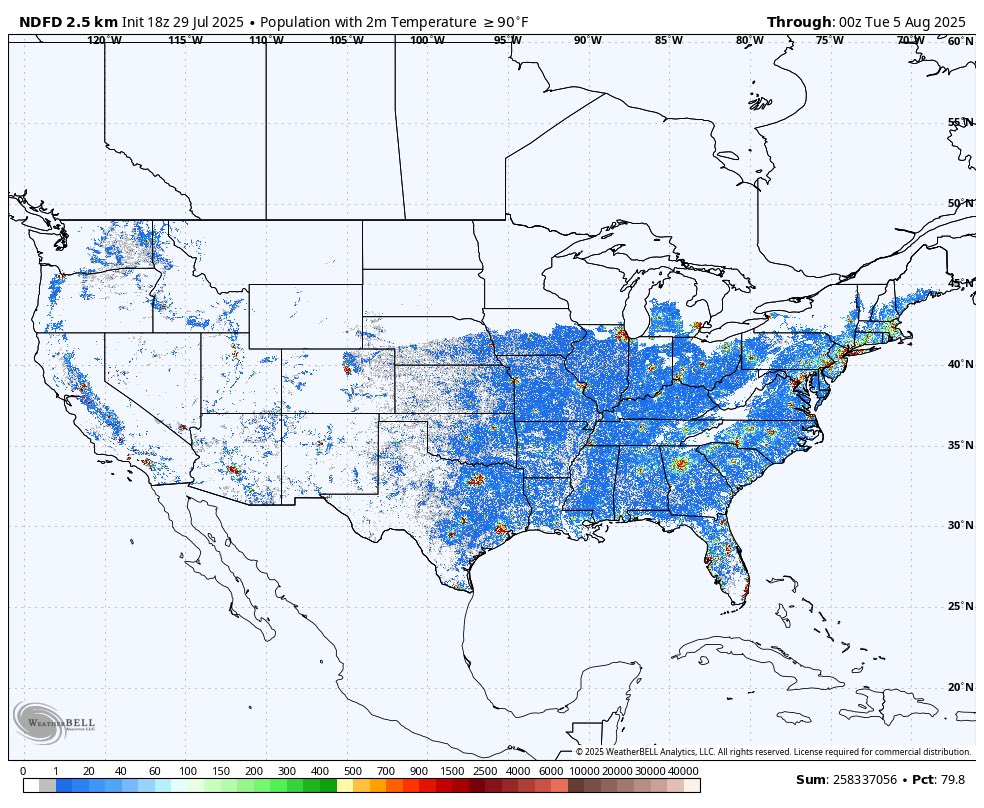
 First, let's establish the sigma. In June the standard deviation from the 20th century mean was about 5-6 in the Western Med and not quite as deviant in the eastern Med. This deviation built larger as the month unfolded and is peaking for now. 2/
 While the exact track/ intensity is to early to know, a hurricane traveling across the Gulf from the west/ WSW is a worst case scenario for, if it hits at or north of the mouth of Tampa Bay. The 1921 borderline Category 3 which hit Tarpon Springs pushed 10-12 ft of surge in 2/
 First from @MichaelFWehner, who is one of the World’s experts on the connection between climate warming and Tropical cyclones.
 Wow now have the capacity for ~12% more moisture. Thus the capacity to fuel more frequent/intense rain. In some cases more moisture means more instability, thus stronger storms & rain rates. Per @MWehner2005 CC spiked Harvey by up to 38%, w/ CC's share of the damage $13B 2/
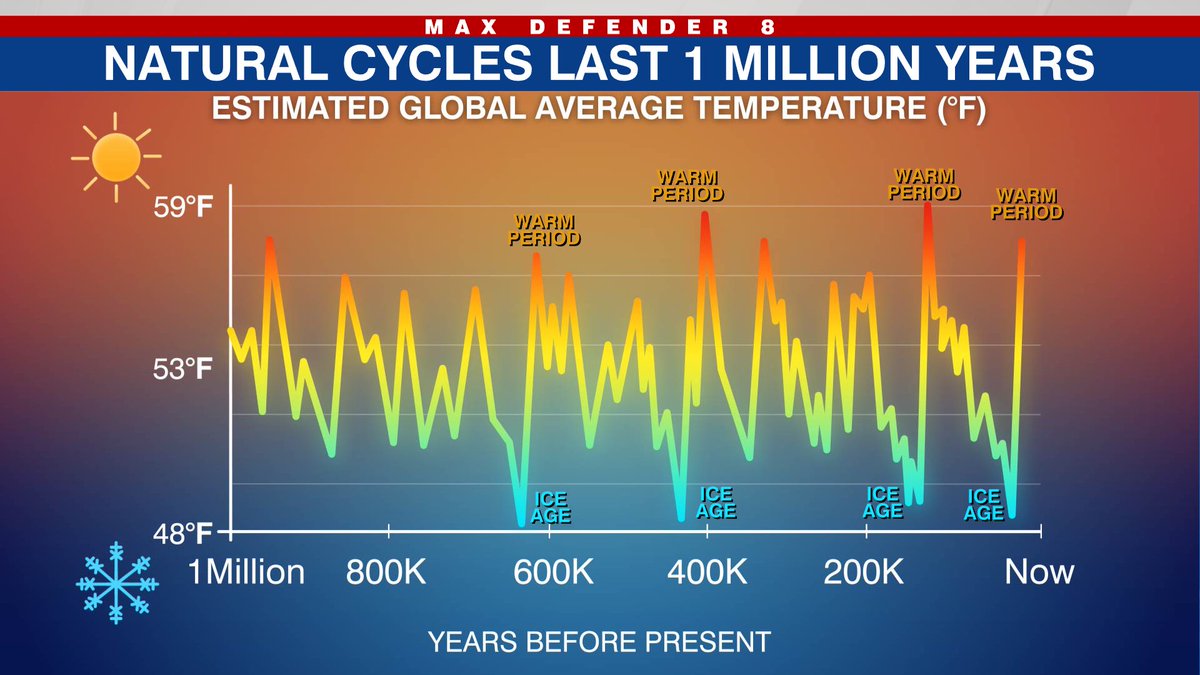
 This is what it looked like at the last glacial maximum. Ice spread all the way down to NYC and Chicago. If you go to Central Park in NYC you can see the edge of where they ended, there are huge boulders there. These ice ages have occurred every ~100K years recently. Here’s why…
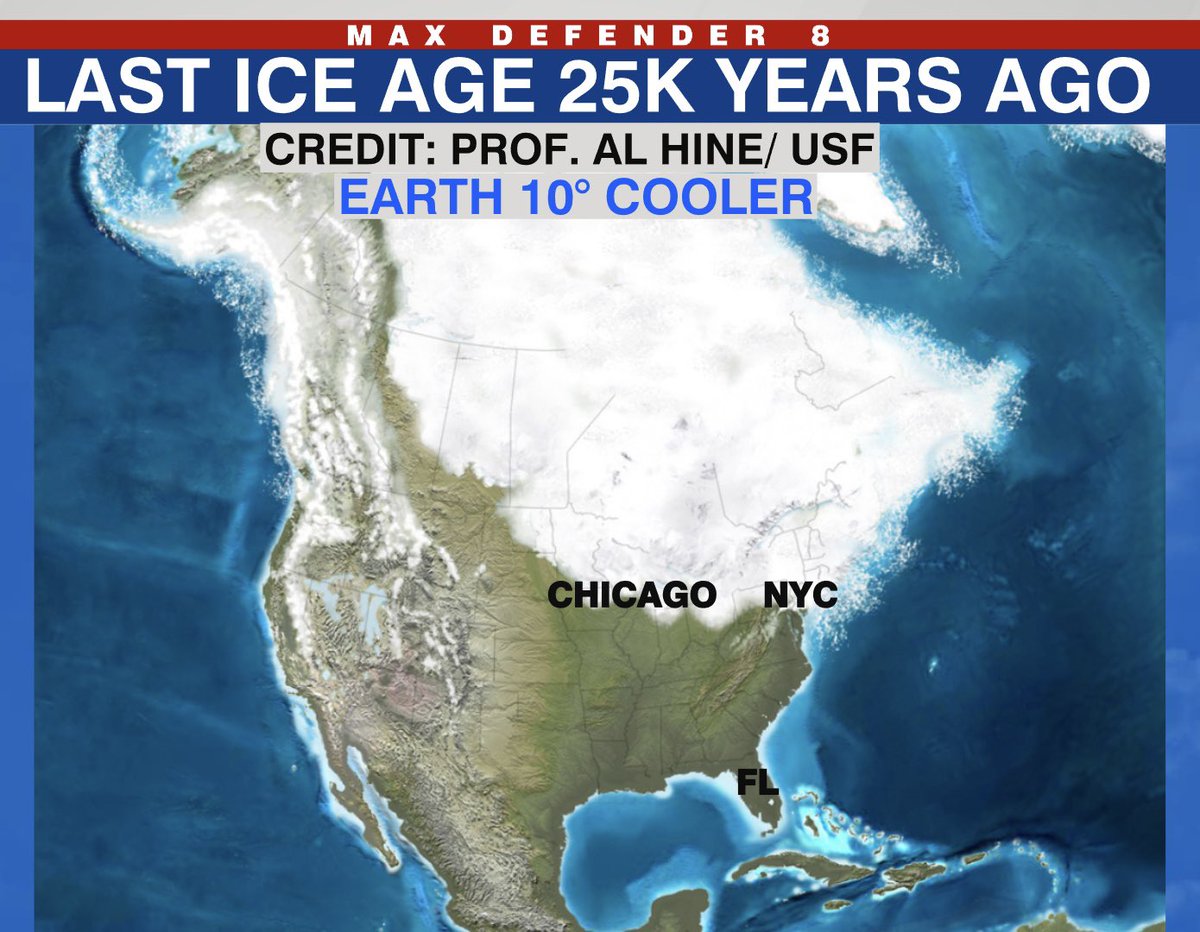
 From 2023-2024 all areas in deep red were record warm. A huge area.


 2/
2/ 
 First the Q of hurricanes. This shows the "maximum" potential wind a hurricane can achieve IF conditions are perfect (light wind shear, minimal dry air, no land interaction). The scale maxes out in the Gulf at 170kts (195 mph). BUT perfection is almost never achieved. And this 2/
 ...explain, with winds from the west, why the low temperature this morning was only 84 (daily record). Dewpoints along the coast have been running 80-82... During the early morning that means a heat index of 95 and with 95+ degree highs, heat index numbers are 110-115+ 2/
 So far in July PHX avg temp is 102.9
 Here's the proof. And notice how a nearby site is 97.5. But it's worth mentioning there was a paper recently showing that these shallow water instruments are possibly registering readings up to a 1 degree elevated. 2/

 The dark blue shading near South Florida and the Gulf of Mexico is appearing weeks early because water temps are at record levels, far above record levels in near South Florida. So if somehow a storm found it’s way here with low shear it could achieve this potential BUT 2/
 The bleaching alert status is Alert level 1. The scale goes to 2. I bring this up because coral are extremely sensitive to slight changes (just a few degrees) in water temp. They have a narrow thermal range. The alarming part is that less than 5% of Keys coral cover is left. 2/