Trendline Investor Profile picture
Jun 6 8 tweets 4 min read Twitter logo Read on Twitter
This STRATEGY can change your Trading approach forever!

📈TRADING using MULTIPLE TIMEFRAMES (MTF)📈

A Top-down Trading approach that will increase your chances of winning...

Ready to learn?🧵...

Let’s go... twitter.com/i/web/status/1… Image
Rule 1⃣: Define your Trading/Investing Style

You can be a
➡️ Long term investor
➡️ Positional trader
➡️ Swing trader
➡️ Intraday trader

Let's take the example of a Positional trader for this 🧵
Rule 2⃣: Identify the LONG TERM TREND on Monthly charts!

The long term chart helps you identify the long term trend & pivotal points in trend changes

In the below #NEULAND chart, you can see the stock has been in a long term uptrend since 2001. Image
Looking for a better video explanation?

I've explained the entire strategy in this video. Do check it out!

Rule3⃣: Wait for a BUY SIGNAL on the Weekly chart!

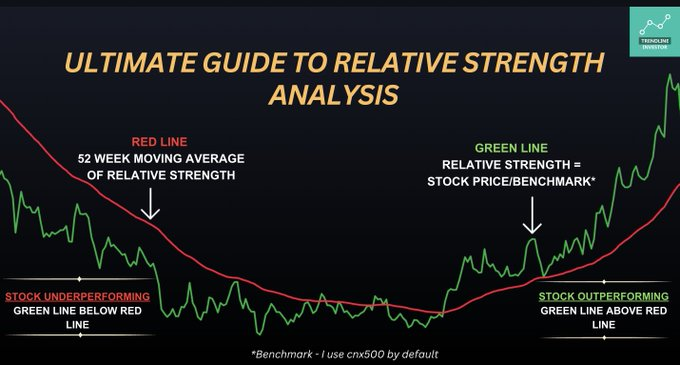
In this chart once you get a buy signal on CCI and RS, take a look at the chart and you will observe the change in trend and breakout.

Now you know this is probably a resumption of the long term trend that started in 2001. Image
Rule 4⃣: Now it is time to hit that 'BUY' button.

But how to IDENTIFY THE ENTRY POINT?

Switch to the 'Daily' chart & buy either on

➡️Retest of breakout zone
➡️Or on the breakout after a short consolidation after 3-5 days Image
But, wait... Are you a swing trader? 🤔

Don't worry, here is a what u should probably follow!

➡️W chart - Trend
➡️D chart - Scan
➡️4/1 hr chart - Buy

This is how you use 3 Timeframes (M/W/D) to identify the Major trend, pin down on a stock & also buy at the right entry point.
Learnt something? If yes, please👇

1. Retweet the first tweet

2. Follow @dmdsplyinvestor

3. Subscribe to my YouTube channel for more content! youtube.com/c/TrendlineInv…

• • •

Missing some Tweet in this thread? You can try to force a refresh
 

Keep Current with Trendline Investor

Trendline Investor Profile picture

Stay in touch and get notified when new unrolls are available from this author!

Read all threads

This Thread may be Removed Anytime!

PDF

Twitter may remove this content at anytime! Save it as PDF for later use!

Try unrolling a thread yourself!

how to unroll video
  1. Follow @ThreadReaderApp to mention us!

  2. From a Twitter thread mention us with a keyword "unroll"
@threadreaderapp unroll

Practice here first or read more on our help page!

More from @dmdsplyinvestor

Jun 8
This is Insane, CHATGPT!

CHATGPT just CODED MY STRATEGY with CCI & RS!🤯

So, you can now code any strategy (in any language) on the internet with this crazy app!

Ready to see how CHATGPT coded Pinescript for me?

Let's go..🧵 twitter.com/i/web/status/1… Image
1⃣Why Pinescript, though? 🤔

Because I have always used Pinescript, and it is the easiest language to learn for someone without a coding background like me.

With GPT-4, it becomes even easier! 😃 Let's see how!

I believe GPT-4 can generate code in any language!
2⃣ Time for the test! 🤓🪧

Okay, so what did I test?

I started off with a simple moving average-based strategy, and here is what I asked GPT-4: Image
Read 14 tweets
Jun 7
MY TRADINGVIEW SETUP - Explained! 🧵

In this 🧵, I cover
- Indicators I use in Tradingview
- Settings for the indicators I use
- Why do I use these Indicators & Settings

Ready to know what I use?...

Let’s go...😃 Image
1 -> Commodity Channel Index(CCI) Indicator to assess Bullishness

- In short, it is a momentum indicator
- Above 100, indicates bullishness
- Below -100, indicates bearishness

If you do not know what CCI indicator is, watch this video 👇
1.1 -> Which CCI indicator to use in Tradingview? 😅

- Search for the inbuilt Commodity Channel Index in 'Technicals' section

- Go to settings -> Inputs -> Length - change this to 34 from default 20

Refer to this video for details👇
Read 12 tweets
Jun 7
The Final Episode of the 'Worst Performing Video Series'! 😃

Masterclass on "STAGE ANALYSIS - Part 4"...🎯
...on my Youtube channel today at 7:30 PM!

Topics
✅ Recap of Stage 1, Stage 2 & Stage 3
✅ How to identify a stock is in Stage 4?
✅ What you should do & not do?
✅ Past… twitter.com/i/web/status/1…
In case you haven't watched, here are the first 3 parts

Part 1 - The Accumulation phase
Part 2 - The Advancing Phase
Read 4 tweets
Jun 2
It took me 10+ years...
...& more than 1000+ hours of practice…

to master these 5 IMPORTANT RULES WHILE DRAWING TRENDLINES 🎯

These simple rules, if mastered, can help one spot HIGH PROBABILITY TRADES!

Ready to learn?🤓

Let’s go🧵… Image
1⃣ Trendlines are zones and not a single line!

- Due to volatility in price, many times prices tend to spike on both sides
- So, consider trendlines as zones from multiple swing highs(include wicks) to get the best fit trendline
- Your winning probability increases with zones Image
2⃣ Trendlines with more touchpoints

- Any trendline with 3 or more touchpoints is a very significant one
- The price points around significant trendlines are important & should be watched

Observe the commentary in the Nifty chart below Image
Read 8 tweets
May 28
The ULTIMATE Indicator - ‘RELATIVE STRENGTH (RS)’!

It is NOT your typical RSI…🤓

...but a crucial tool that can transform your trading/investing approach!

Let's unpack it using the #TATASTEEL chart...📈

Let’s go 🧵… Image
1⃣ But, how will it change the way I trade?

- Ever wondered why the stock you are holding is not moving when the market is ripping higher?

Ex: ITC didn't move btwn June’20 & Feb’22 while the market rallied

This indicator will help you get rid of such underperforming stocks. Image
2⃣ ok, what’s RS?

When stock A goes...

- up faster than Nifty, it is STRONG/OUTPERFORMING relative to Nifty
- down faster than Nifty, it is WEAK/UNDERPERFORMING relative to Nifty

So, RS is relative performance of a stock compared to any benchmark (refer chart for example) Image
Read 20 tweets
May 26
FREE Trading Course...🎉
...that will save you from losing your capital!

Trading Concepts, Scanners, Strategies & much more!

All you need is dedication + discipline to follow it!

Let's learn...🤓🧵 Image
1⃣ All about CANDLESTICKS!

How to read CANDLESTICKS without knowing the names?

Candlesticks are the foundation of charting and I cover how to read candlestick charts without needing to know the names of them
2⃣ When to use LOG/LINEAR CHARTS?

Even the biggest handles get this simple concept wrong and I teach how you can have a better perspective on charting by making a simple switch to log charts

Read 26 tweets

Did Thread Reader help you today?

Support us! We are indie developers!


This site is made by just two indie developers on a laptop doing marketing, support and development! Read more about the story.

Become a Premium Member ($3/month or $30/year) and get exclusive features!

Become Premium

Don't want to be a Premium member but still want to support us?

Make a small donation by buying us coffee ($5) or help with server cost ($10)

Donate via Paypal

Or Donate anonymously using crypto!

Ethereum

0xfe58350B80634f60Fa6Dc149a72b4DFbc17D341E copy

Bitcoin

3ATGMxNzCUFzxpMCHL5sWSt4DVtS8UqXpi copy

Thank you for your support!

Follow Us on Twitter!

:(