The great William O'Neil taught many how to 'fish' for their own food in the market & equipped the regular trader with skills to change financial futures.
Here are 20 of my favorite charts from one of his best resources, "How to Find & Own America's Greatest Opportunities":
Here are 20 of my favorite charts from one of his best resources, "How to Find & Own America's Greatest Opportunities":
1. Accustaff Weekly from 1995.
One of the most beautiful moves out of an IPO that I've ever seen.
One of the most beautiful moves out of an IPO that I've ever seen.

2. Yahoo Inc. Weekly from 1997.
Every time I look at this chart I pick up something new.
Every time I look at this chart I pick up something new.

3. Newbridge Networks from 1991.
One of the key points here is that it made a major run from $2.8 to $9, consolidated, and then went from $9 to $70.
YOU DON'T HAVE TO BOTTOM FISH TO MAKE MONEY!
One of the key points here is that it made a major run from $2.8 to $9, consolidated, and then went from $9 to $70.
YOU DON'T HAVE TO BOTTOM FISH TO MAKE MONEY!

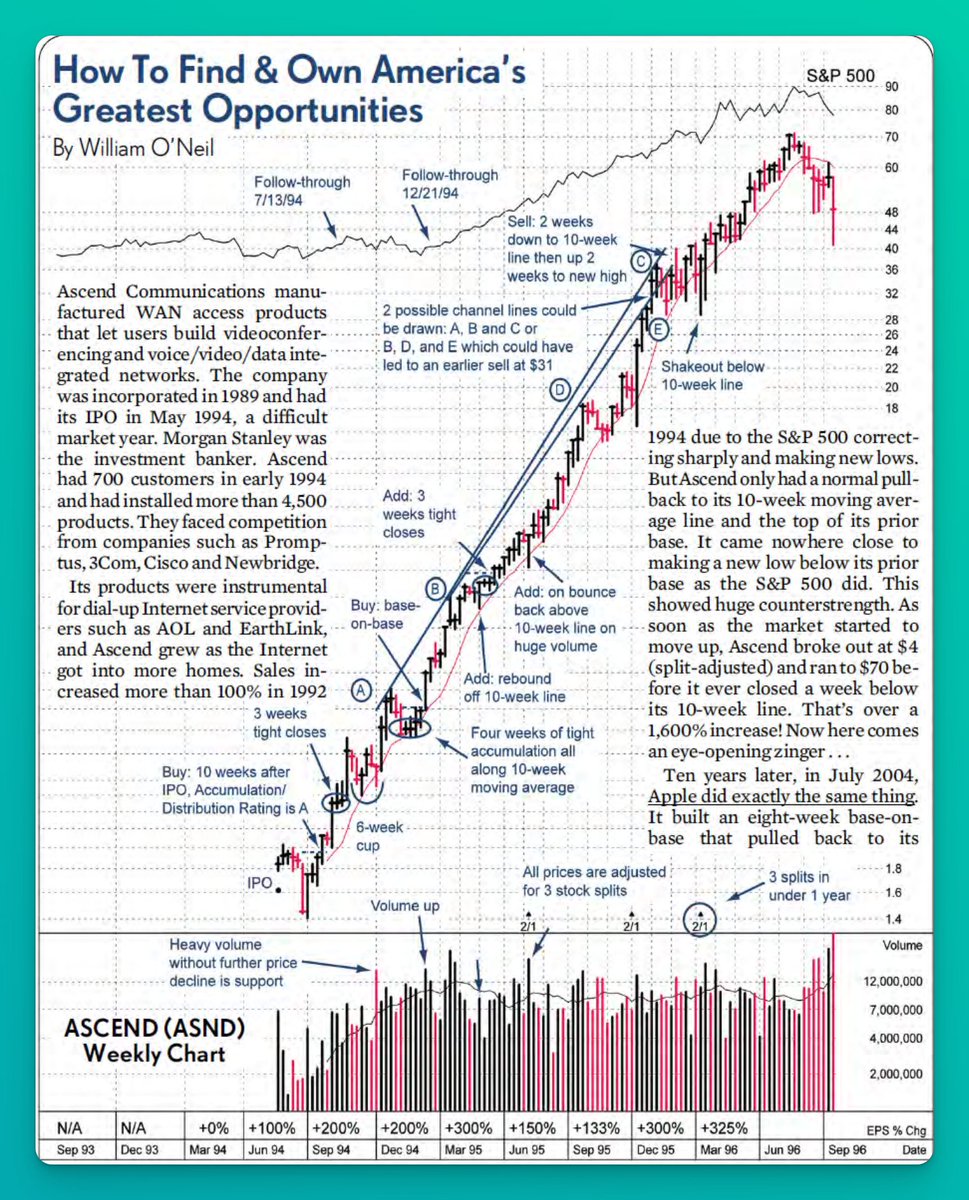
4. Ascend Weekly from 1994.
Right up there with Accustaff (chart #1) as one of the most impressive IPO moves of all time.
Right up there with Accustaff (chart #1) as one of the most impressive IPO moves of all time.
5. Monogram Industries from 1965.
Another example that shows with a solid process, you don't have to bottom fish to make an unbelievable amount of money.
Another example that shows with a solid process, you don't have to bottom fish to make an unbelievable amount of money.

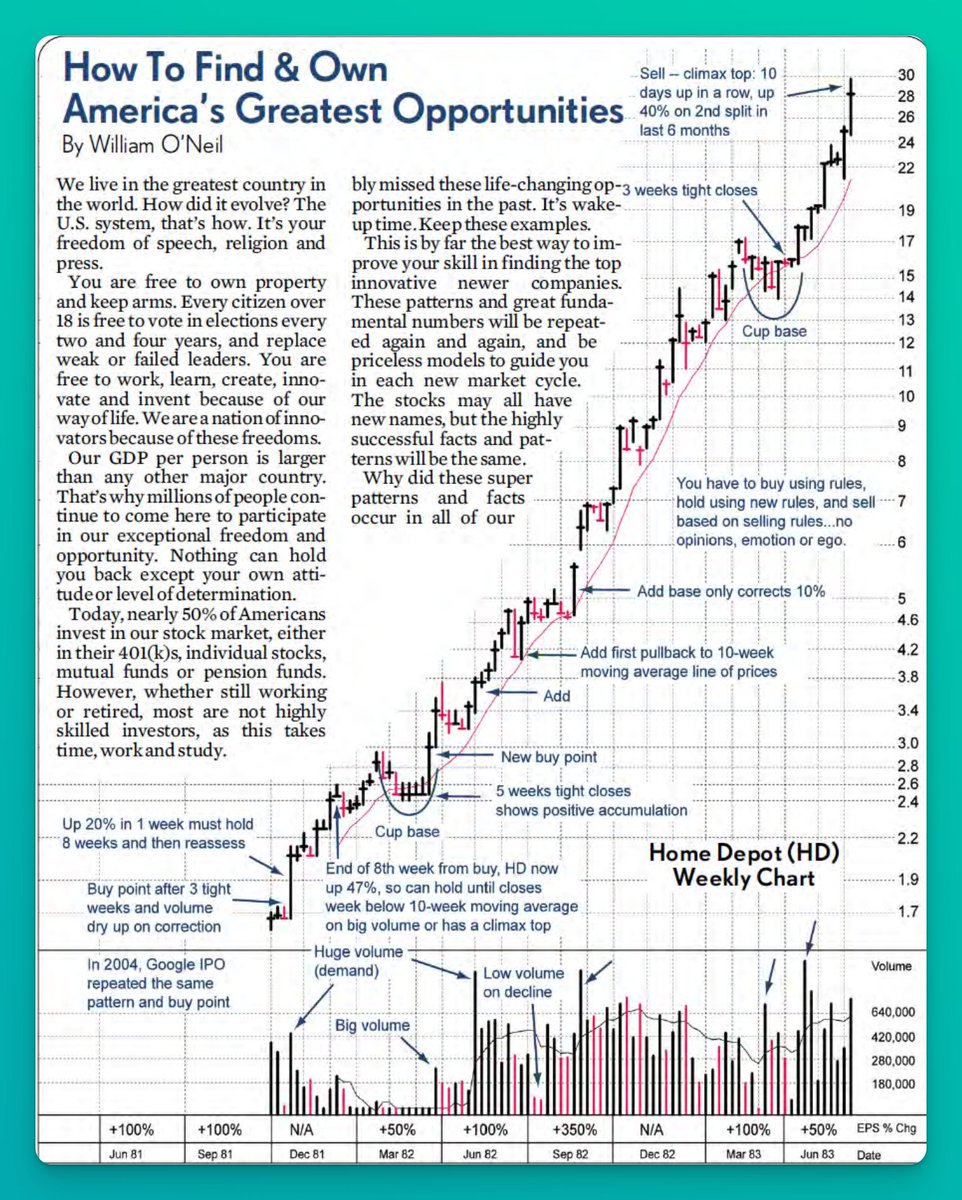
6. Home Depot Weekly from 1981.
$2 bucks to $30 in only 2 years, closing below the 10 week MA only a handful of times throughout the entire move.
$2 bucks to $30 in only 2 years, closing below the 10 week MA only a handful of times throughout the entire move.
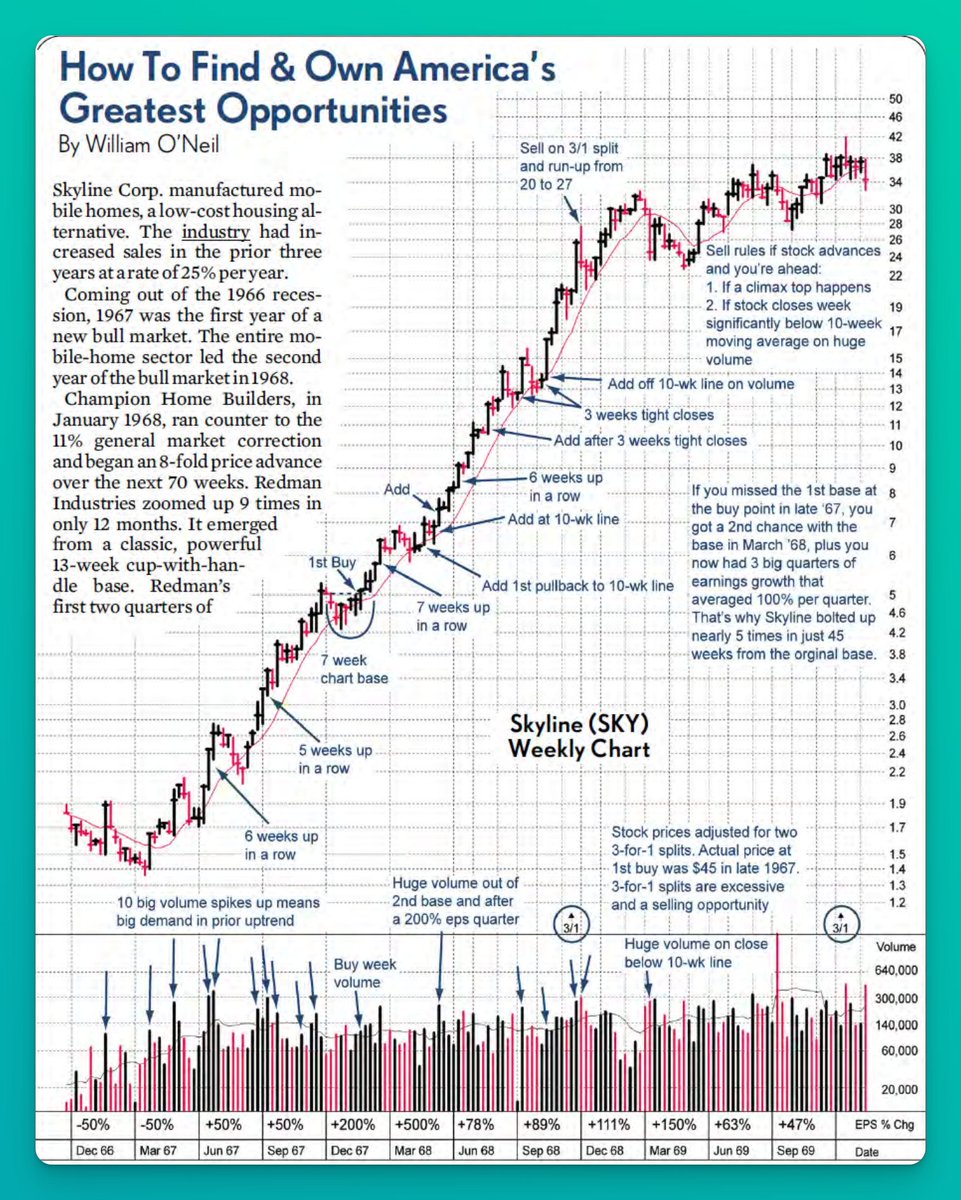
7. Skyline Corp. from 1967.
The accumulation volume in this name is insane as WON highlights multiple times with his black arrows in the bottom panel.
Institutions can't hide when they want a name.
The accumulation volume in this name is insane as WON highlights multiple times with his black arrows in the bottom panel.
Institutions can't hide when they want a name.
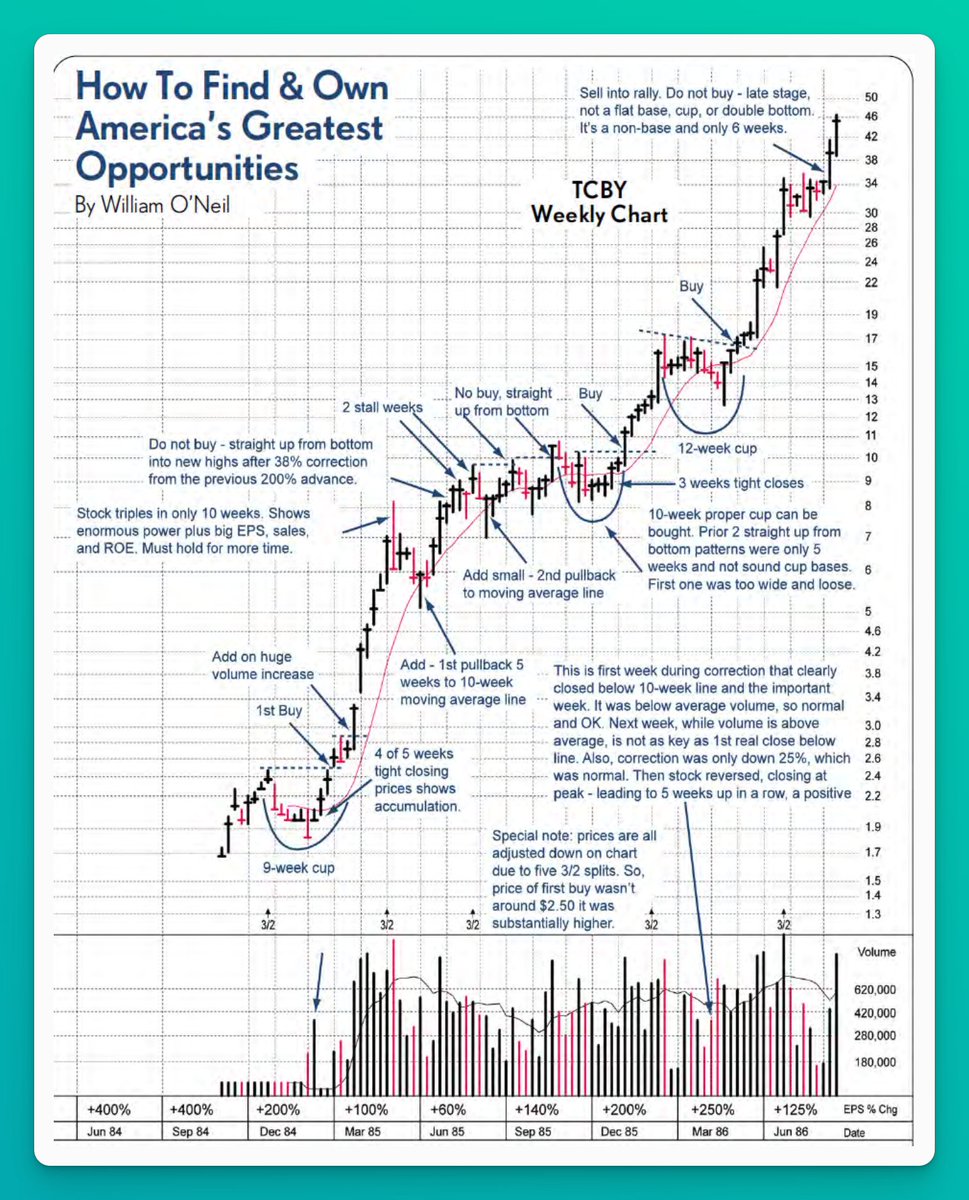
8. TCBY Weekly from 1985.
Note the tight closes in the first cup base as WON outlines.
Low volume + tight closes = accumulation.
I'm a big fan of this example because of how many buying opportunities it gave.
Wait for the right moment (mastered through $STUDY) & pounce!
Note the tight closes in the first cup base as WON outlines.
Low volume + tight closes = accumulation.
I'm a big fan of this example because of how many buying opportunities it gave.
Wait for the right moment (mastered through $STUDY) & pounce!
9. Taser International from 2001.
Got to be the best chart in history, no?
Got to be the best chart in history, no?

10. Qualcomm Weekly from 1997.
Took 3 massive bases to get going from $10 to $150.
No weekly close was ever below the 10 week MA until after the climax top sell signal.
Took 3 massive bases to get going from $10 to $150.
No weekly close was ever below the 10 week MA until after the climax top sell signal.

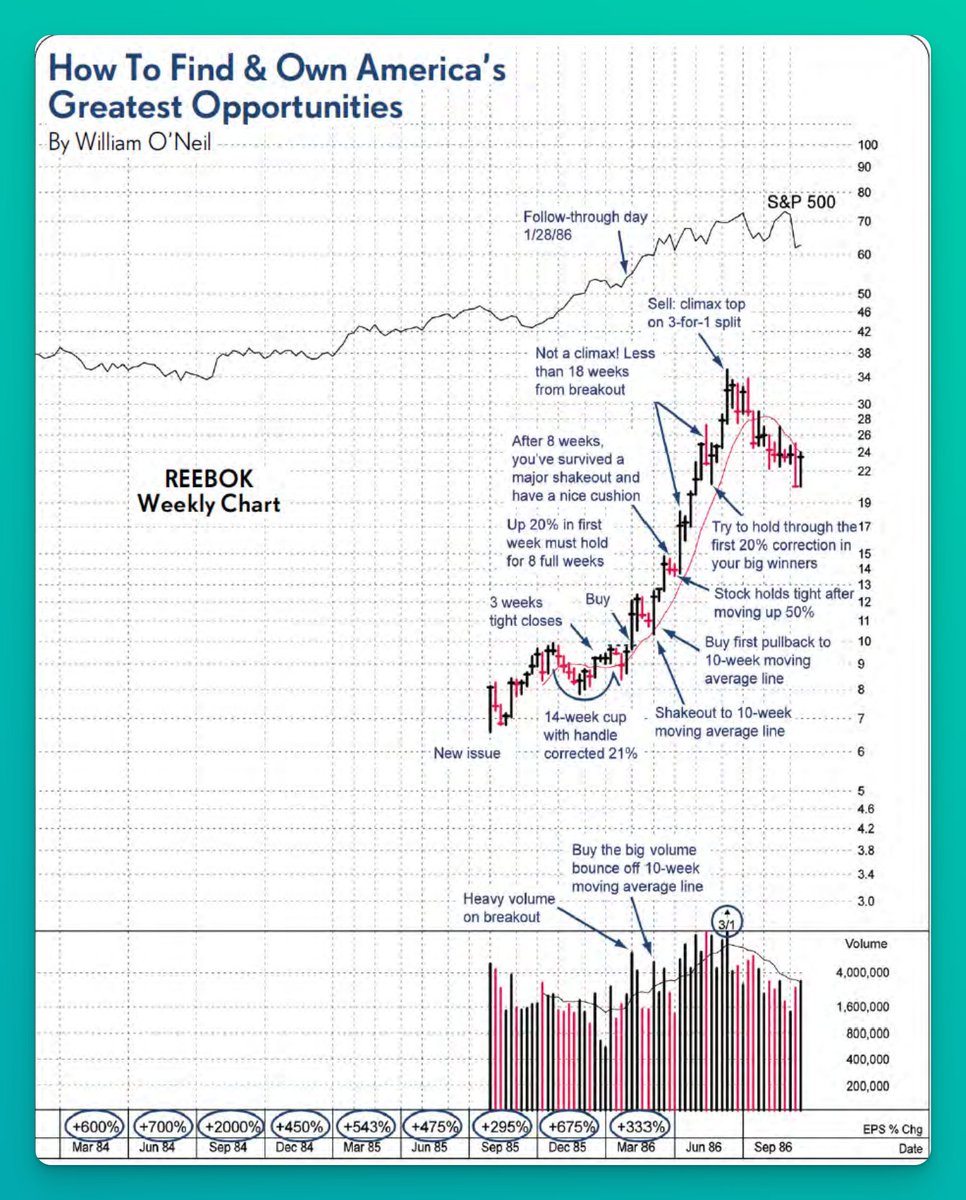
11. Reebok from 1985.
I like the real-world application of this chart as it was a sneaker name that was up and coming during the time.
Note the earnings accelerations...
I like the real-world application of this chart as it was a sneaker name that was up and coming during the time.
Note the earnings accelerations...
12. Priceline Weekly from 2005.
The epitome of lower left to upper right.
Great notes by WON.
The epitome of lower left to upper right.
Great notes by WON.

13. Storage Technology Weekly from 1976.
A multi-year base breaks out with what is most likely an earnings gap up if we were to zoom into the daily chart that then rode the 10-week all the way up to a 1000% gain.
A multi-year base breaks out with what is most likely an earnings gap up if we were to zoom into the daily chart that then rode the 10-week all the way up to a 1000% gain.

14. Hansen Natural & Monster Energy from 2004.
An originally choppy move in the lower left turns into a controlled uptrend above the rising 10-week MA.
Note the amount of add points on this name!!
An originally choppy move in the lower left turns into a controlled uptrend above the rising 10-week MA.
Note the amount of add points on this name!!

15. Crocs Inc from 2005.
Another name that lead after the recent bear market to start the early 2000s.
Again, tight weekly closes on low volume = accumulation!
Another name that lead after the recent bear market to start the early 2000s.
Again, tight weekly closes on low volume = accumulation!

16. Alliance Semiconductor from 1994.
Note the increase in volume on breakout right after the 7/13/1994 Follow Through Day.
Leading stocks can still break out and lead the market higher AFTER a FTD!
Note the increase in volume on breakout right after the 7/13/1994 Follow Through Day.
Leading stocks can still break out and lead the market higher AFTER a FTD!

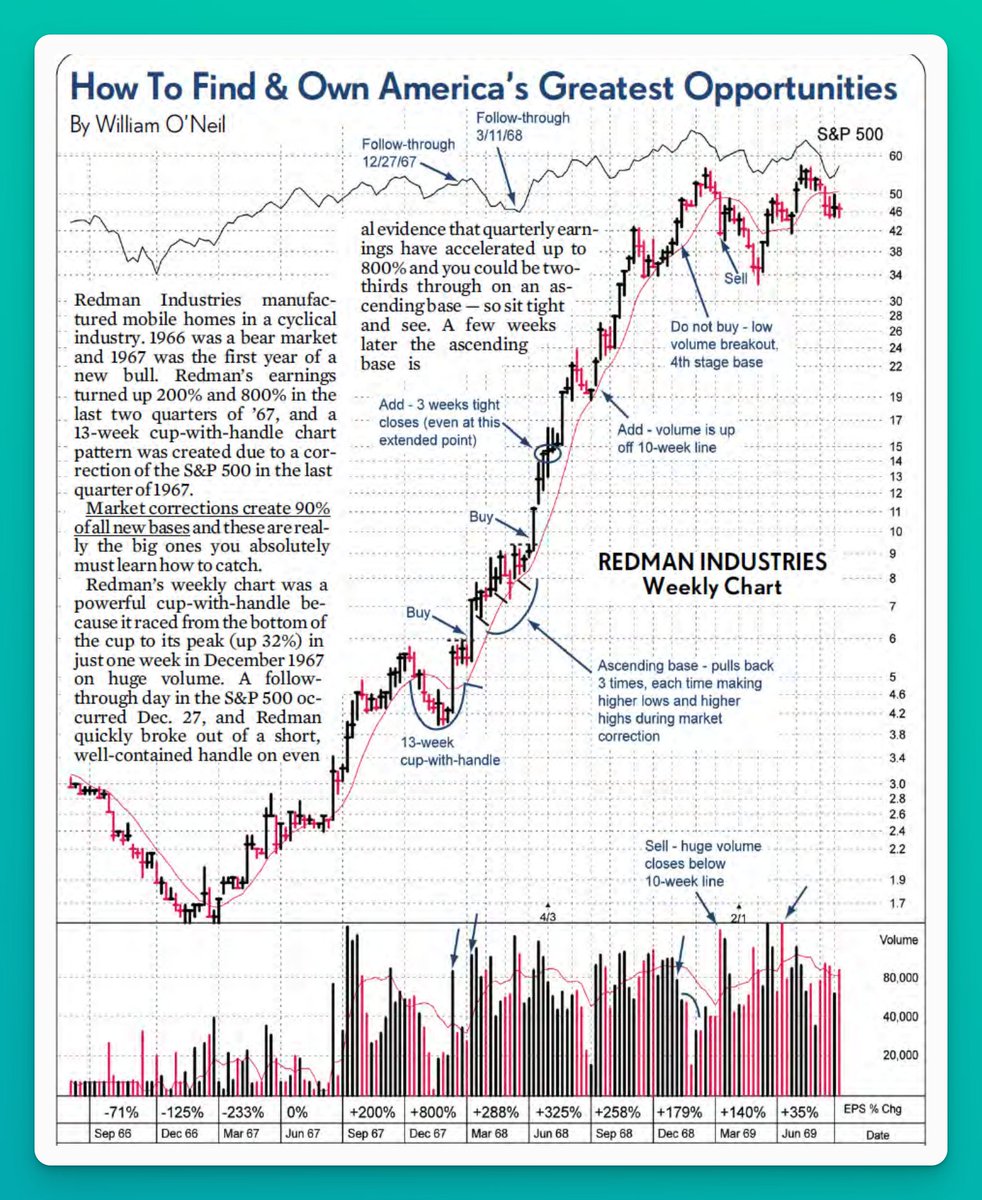
17. Redman Industries Weekly from 1969.
An example of volume coming into the name in the early stages as a sign of institutional accumulation, but the proper buy point didn't happen until after a large base.
You don't have to be early, be on time!
An example of volume coming into the name in the early stages as a sign of institutional accumulation, but the proper buy point didn't happen until after a large base.
You don't have to be early, be on time!
18. Syntex Weekly from 1962.
Easily one of the top 5 best stock charts in history right here.
10-week MA acts as a perfect guardrail to the upside.
Easily one of the top 5 best stock charts in history right here.
10-week MA acts as a perfect guardrail to the upside.

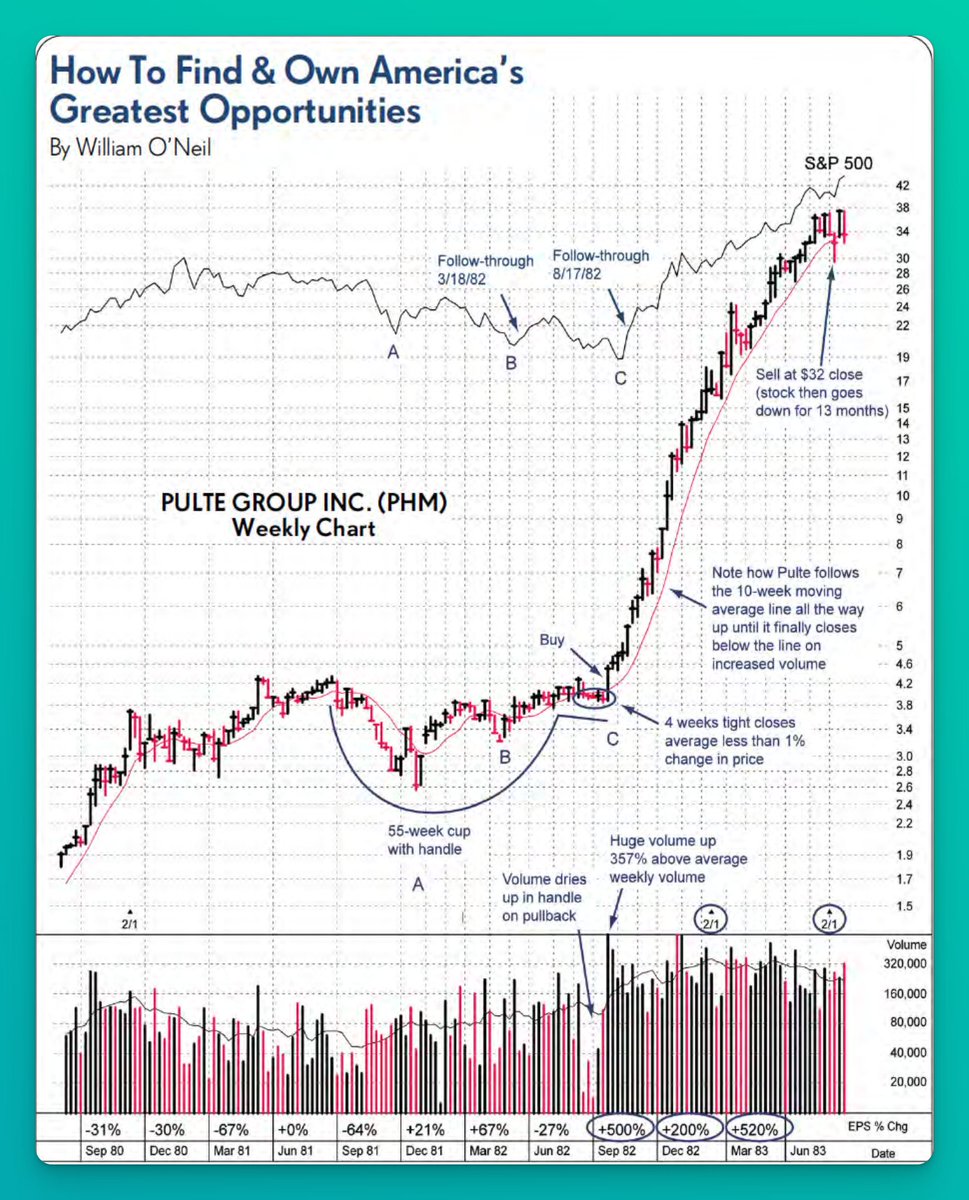
19. Pulte Group from 1980.
Larger the base, higher the space!
Larger the base, higher the space!
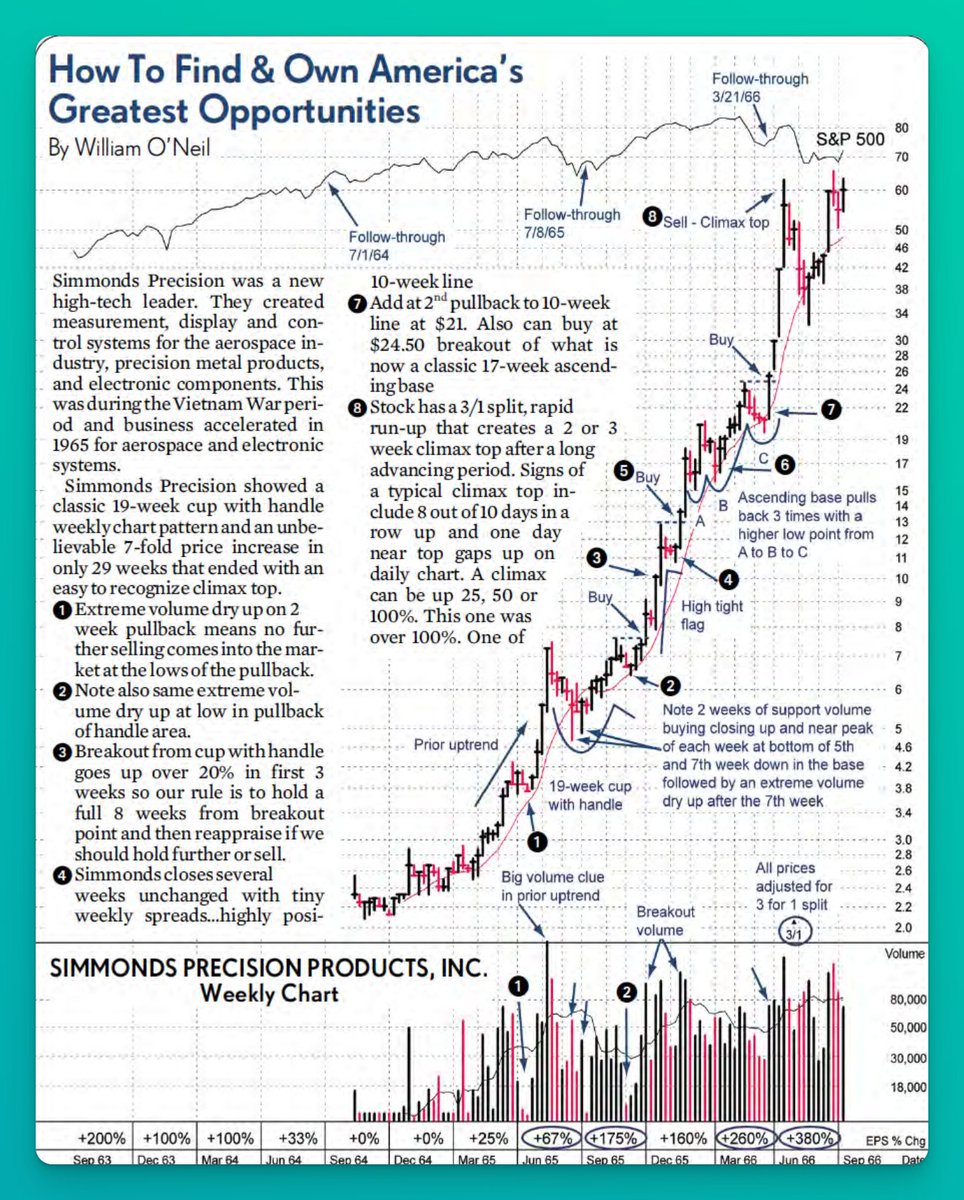
20. Simmonds Precision Products, INC in 1963.
This mark up goes to show the level of expertise and analysis WON was able to articulate on a chart.
Multiple points outlining the exact actions investors/traders need to learn how to recognize on their own in real-time.
This mark up goes to show the level of expertise and analysis WON was able to articulate on a chart.
Multiple points outlining the exact actions investors/traders need to learn how to recognize on their own in real-time.
I specifically left off the extra descriptions that WON gave so you would feel obligated to go study the gold he puts in extra paragraphs describing each chart. 😉
Here's the link to the full resource:
s3-us-east-2.amazonaws.com/marderreport/w…
Here's the link to the full resource:
s3-us-east-2.amazonaws.com/marderreport/w…
The first 100 charts in O'Neil's "How To Make Money In Stocks" are unbelievable, but clear annotations along with a full description of every factor that played into his analysis is what separates this resource from the rest.
R.I.P. to the GOAT.
R.I.P. to the GOAT.
That's it!
I hope you've enjoyed this thread.
Also please like/retweet the tweet below to share with a fellow trader:
I hope you've enjoyed this thread.
Also please like/retweet the tweet below to share with a fellow trader:
https://twitter.com/GregDuncan_/status/1666135364560621568
If you found this valuable, you'll definitely find value in my weekly newsletter.
Investing tools & insights catered towards high performance in 10 minutes or less.
Join 1300+ traders & investors looking to push the limits of their performance:
upsideunlimited.com/sub
Investing tools & insights catered towards high performance in 10 minutes or less.
Join 1300+ traders & investors looking to push the limits of their performance:
upsideunlimited.com/sub
• • •
Missing some Tweet in this thread? You can try to
force a refresh