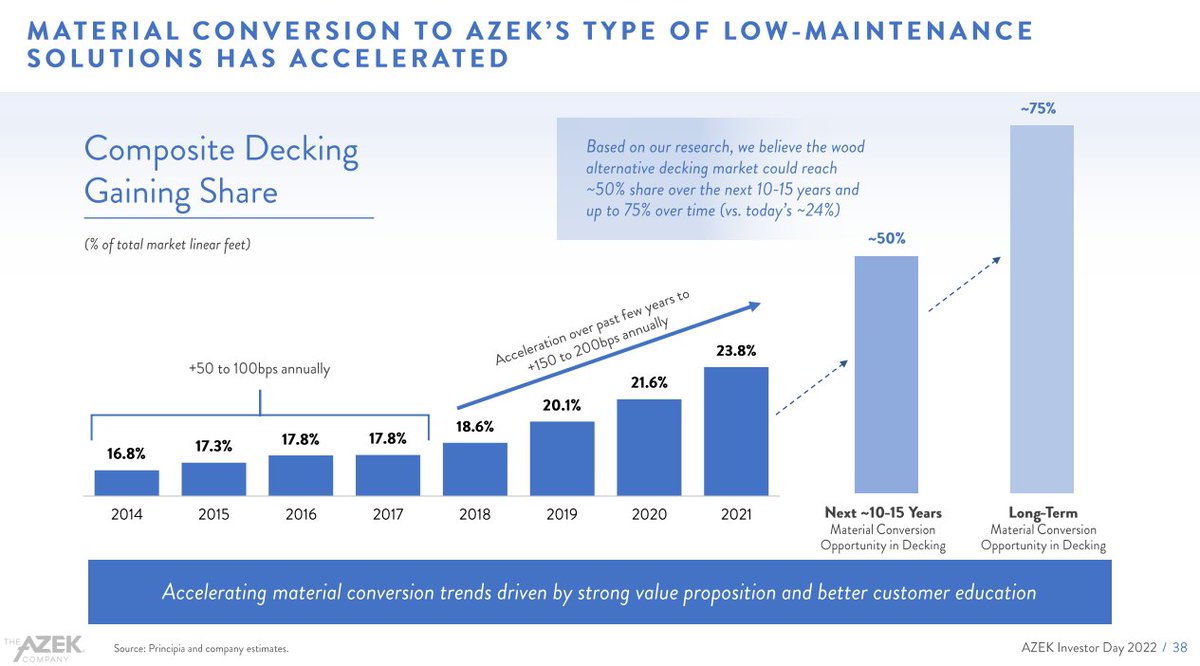
Composite decking made by companies like $TREX & $AZEK still only comprises ~24% of total decking used (in linear ft) despite a vastly superior value proposition vs. wood
Large secular growth opportunity long term as an increasing number of decks built convert to composites
Both $TREX & $AZEK see ~50-75% share possible long term, providing ~2-3x industry upside
this is before other growth factors that further add to the industries growth opportunity
(i.e. total R&R growth, total decks built, intl expansion, price increases, etc.)
Given $TREX and $AZEK's attractive duopoly, commanding combined ~80% share, nearly all the industries incremental growth should accrue to them
A wide swatch of competitive advantages, high barriers to entry and unique characteristics inherent in the building products space around distribution and contractor, dealer & distributor loyalty make $TREX and $AZEK's duopolistic position highly defensible
• • •
Missing some Tweet in this thread? You can try to
force a refresh
KPI’s like housing starts, home prices, home equity & mortgage rates are seen as classic primary drivers of demand for the industry & names like $HD, $LOW & $FND
Zonda noted real personal income actually has the highest correlation to changes in home improvement spending though
Due to inflation outstripping wages, real personal income has been in decline y/y now for ~14 mos since 3/22
Combined with moderating home prices & increased rates, trends typically would imply a -15-20% decline in remodeling spend based on historic periods, per Zonda’s analysis
While small, nice to see $FND out after the close yesterday with a tuck-in acquisition for the Spartan side of its commercial business – acquiring Salesmaster Flooring Solutions
Salesmaster augments Spartans Northeastern footprint by adding presence in NYC & New England markets
Per $FND's investor day last yr., NYC in particular was an area Spartan really lacked meaningful sales rep coverage
Salesmaster helps fill in key coverage for one of the largest commercial flooring MSA’s in the country
Salesmaster, per its website, has ~24 sales reps, a sizable boost to Spartan’s ~65 reps (+37%)
When Spartan was first acquired, their reps had around ~$2mln/rep in sales productivity
If we use this, it would imply Salesmaster has around ~$48mln in revenue
$SITE is the dominant US wholesale landscape distributor by a wide margin
- >3x larger than its nearest competitor
- >8x larger vs the #3 player
- massive in scale vs. the balance of the industry which is largely comprised of small local mom & pop's
$SITE is unique vs many other distribution businesses in that it faces no other nationally scaled full product line wholesale distributor of landscape supplies
$SITE also has high similarities to $POOL in its early years
$SITE is still in relatively early innings of consolidating and carving out a mature market position in the wholesale landscape distribution niche, and is rapidly taking market share
While $FND has a fragmented base of over ~240 suppliers, many be unaware of $FND's largest & most important supplier & its high concentration in a particularly key flooring category
Some key notes...
Per industry calls, $FND's largest supplier is Creative Flooring Solutions (CFL Flooring), previously known as China Floors
CFL serves as $FND's primary supplier of LVT making key private label brands like Nucor, AquaGuard and DuraLux. These are exclusive to $FND
Per the 10-K, CFL makes up ~16% of $FND sales
CFL only manufactures/sells LVT product. With LVT at ~28%/sales, this implies CFL supplies around ~60% of $FND's LVT
While $FND's Q1'23 top & bottom line results came in modestly better than expectations, shares were off -5% on Friday as KPI trends in SSS comp, transactions, & ticket – both in the qtr. and so far in Q2 – were weaker than expected.
My key notes from the release & call.
$FND revenue up +9.1% (est +8.2%) via a -3.3% comp with +12.4% new store growth. EBITDA up +10.2% (est +7.6%) w/+14bps in leverage (est -8bps) as +15% gross profit growth (est +13%) & +214bps in gm exp (est +175bps) was offset by -210bps deleverage from +17% OPEX growth (ex depr)
$FND comps decelerated from +2.5% in Q4 to -3.3% as last qtrs decel trend – Oct +5.6%, Nov +1.3%, Dec +0.6% - continued w/Jan’s -0.1% comp falling to -3.7% in Feb, -5.2% in Mar & -6.2% in April. Per mgmt foot traffic did improve in April with some comp improvement so far in May
1| Home Depot $HD Q4'22 Earnings
$HD's Q4’22 release provided some important read throughs on the home improvement market and names like $FND. The following thread is a collection of some key takeaways from my notes.
2| Results
$HD was off -7% yesterday on sustained but more pronounced deceleration in Q4. Sales growth slowed from +6.5%/+5.6% in Q2/Q3 to +0.3% in Q4. SSS comps slowed from +5.8%/+4.3% in Q2/Q3 to -0.3% in Q4 with choppy and negative mo. trends. Nov -1.3%, Dec +0.8%, Jan -0.1%
3| Results [2]
Key driver of $HD sales & SSS comp deceleration is via both declines in ticket – which fell from +9% in Q2/Q3 to +6% in Q4 – supplemented by further transaction declines that accelerated from declines of -3%/-4% in Q2/Q3 to a decline of -6% in Q4