kumar saurabh Profile picture
Jun 8, 2023 10 tweets 4 min read Read on X
#NIIT All about NIIT Demerger. So, NIIT demerger happened and the B2C business now trades at Rs 98. The HIGHLY profitable B2B business is yet to be listed but here is brief analysis.
NIIT has 2 businesses:
B2C: NIIT Limited: Retail learning
B2B: Corporate Learning
The B2C business is more volatile and did just a breakeven this year where as the corporate learning business is high growth high margin business. Here is P&L for B2B business. So, in B2B, we are getting a 20% growth business at 23% EBITDA margin doing ~200 Cr of PAT Image
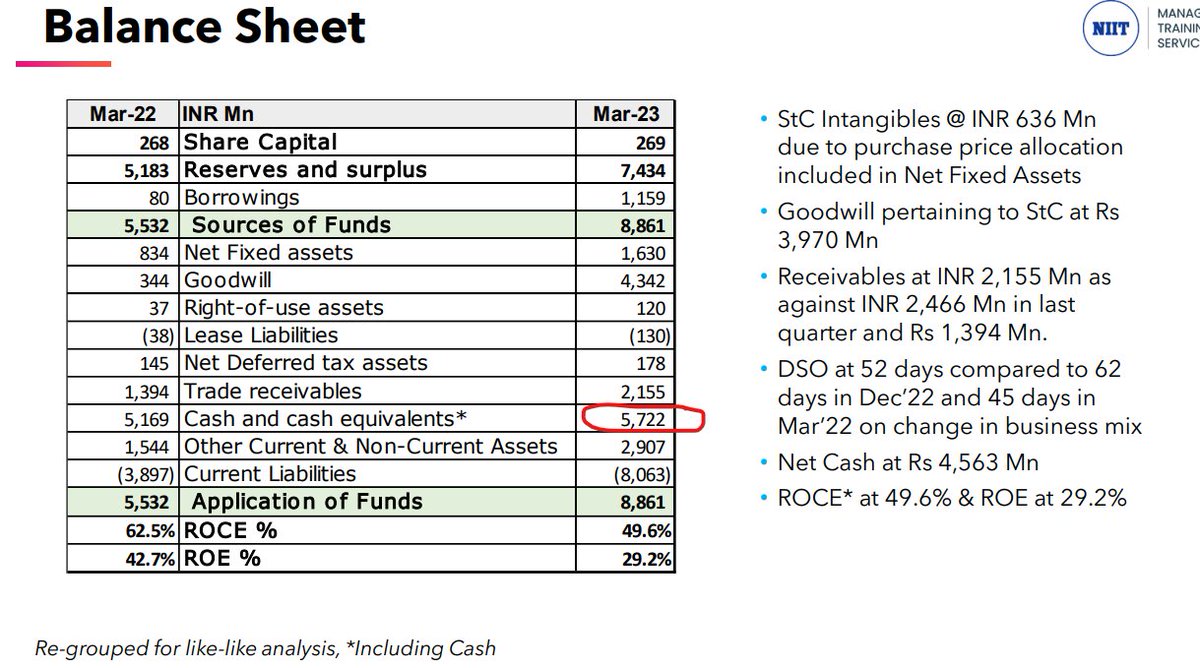
Also, post demerger, B2B business (NLSL) will have Rs 572 Cr of cash on books Image
Coming to B2C (NIIT Ltd) business which remains listed and now trades at Rs 98 compared to pre-demerged price of Rs 400, it has a sales of Rs 314 Cr and merely does any profit. Here is the P&L Image
The B2C business (NIIT Ltd) has got Rs 715 Cr of cash post demerger Image
Now, this is how post demerger scenario looks like. All holding 1 share of NIIT Ltd pre demerger will get 1 share each of both companies post demerger. So, totally, 13.5 Cr shares of both companies will trade.
B2C (NIIT Ltd): At current price of Rs 98, this trades at Rs 1300 Cr Image
valuation with Rs 715 cr cash, Rs 314 Cr of sales and a fluctuating profit. The pre-merger price of Rs 400 had a market capitalization of Rs 5400 Cr which leaves Rs 4100 Cr valuation for to be listed B2B business if assume the same Rs 5400 market capitalization remains. So, we Image
will get a Rs 200 Cr PAT business with 23% EBITDA margin growing at 20% with Rs 500 cash on books at 20x multiple. The question to ask now is:
Do these 2 businesses deserve a better valuation than above stated scenario or lesser and there the answer would lie if we will value Image
creating or value destructing. Disc: have a pre demerger position at Rs 380. Transacted in last 30 days. I may buy or sell without informing. Alos, these number been taken from latest price data and there could be an error. Please do your own due diligence.
If interested in tracking financial markets, you may follow me. Also, you may subscribe to our youtube channel. Thanks for reading. Like & RT for wider reach 🙏
youtube.com/ScientificInve…

• • •

Missing some Tweet in this thread? You can try to force a refresh
 

Keep Current with kumar saurabh

kumar saurabh Profile picture

Stay in touch and get notified when new unrolls are available from this author!

Read all threads

This Thread may be Removed Anytime!

PDF

Twitter may remove this content at anytime! Save it as PDF for later use!

Try unrolling a thread yourself!

how to unroll video
  1. Follow @ThreadReaderApp to mention us!

  2. From a Twitter thread mention us with a keyword "unroll"
@threadreaderapp unroll

Practice here first or read more on our help page!

More from @suru27

Feb 19
Yesterday, I shared this data point of % of companies hitting 52 week low close to ILFS Oct 2018 number.
Question is what is the significance of this data?

Let us explore
The reason to share this data is much more interesting. In current market, people would say - do not catch falling knife, let it bottom etc.

What if you invested in all those days when more than 20% companies were making 52 week low?

Can you backtest return of all such scenarios since last 10-20 years?

Got reminded of my Face2Face video done 4 years back where I presented lot of backtested outputs including how your returns would pan out

Here is this data right from 2006. The red bars are % of companies making 52W lowImage
Though some of these metric are gaining popularity now, we had done lot of exploratory analysis and backtesting around these metric 4-5 years back when I was conceptualizing Scientific Investing . You can watch the full video here:
Read 6 tweets
Feb 9
SMALLCAP 250

For SMALLCAP 250, based on Q3FY25 results so far:
❓Best performing companies?
❓Attractively valued companies?
❓Both attractively valued and best performing?

🧵to answer all such questions to help to filter interesting ideas for research Image
Image
Image
Image
💡 Companies delivering >15% sales growth Image
Read 12 tweets
Feb 7
NIFTY NEXT 50

For NIFTY NEXT 50, based on Q3FY25 results so far:
❓Best performing companies?
❓Attractively valued companies?
❓Both attractively valued and best performing?

🧵to answer all such questions to help to filter interesting ideas for research Image
💡 Companies delivering double digit sales growth Image
💡 Companies delivering double digit PAT growth Image
Read 9 tweets
Feb 6
NIFTY 50

For NIFTY 50, based on Q3FY25 results so far:
❓Best performing companies?
❓Attractively valued companies?
❓Both attractively valued and best performing?

🧵to answer all such questions to help to filter interesting ideas for research Image
💡 Companies delivering double digit sales growth Image
💡 Companies delivering double digit PAT growth Image
Read 7 tweets
Jan 11
Aarti Pharmalabs Limited

1/15 🚀 Introducing Aarti Pharmalabs Ltd!
They make APIs, Xanthine Derivatives, and offer CDMO/CMO services for drug development and manufacturing.
Let’s break it down step by step! 🧵👇
2/15 🏢 Company Background:
● Originally part of Aarti Industries, Aarti Pharmalabs became a separate entity in 2022.
● Focus: Manufacturing key pharmaceutical ingredients, intermediates, and offering contract manufacturing for drug development.
● Their goal? To supply high-quality ingredients for medicines, energy drinks, and supplements globally.
3/15 🌿 What are APIs (Active Pharmaceutical Ingredients)?
● APIs are the active components in medicines that provide therapeutic effects.
○ Example: The ingredient in cancer, pain relief, and respiratory drugs.
● Intermediates are chemical compounds used to create APIs.
○ Think of intermediates as the building blocks of medicines
➡️ Aarti manufactures both!Image
Read 16 tweets
Dec 31, 2024
RBI released Financial Stability Report - Dec 2024 (half yearly publication covering financial sector)

🧵 sharing key insights and visuals from the report covering macro, banking, investment and other regulatory aspects after going through the report Image
To start with market, how much the EPS needs to grow to justify the existing valuation against historic multiple.

Against this, Q2 growth was below 10% YoY
Do track our newsletters where we cover such things in detail on quarterly basis:
Subscribe to Newsletters: scientificinvesting.in

Old Newsletters: scientificinvesting.in/news.phpImage
Demand for equity hitting through the roof outpacing supply in last few years Image
Read 23 tweets

Did Thread Reader help you today?

Support us! We are indie developers!


This site is made by just two indie developers on a laptop doing marketing, support and development! Read more about the story.

Become a Premium Member ($3/month or $30/year) and get exclusive features!

Become Premium

Don't want to be a Premium member but still want to support us?

Make a small donation by buying us coffee ($5) or help with server cost ($10)

Donate via Paypal

Or Donate anonymously using crypto!

Ethereum

0xfe58350B80634f60Fa6Dc149a72b4DFbc17D341E copy

Bitcoin

3ATGMxNzCUFzxpMCHL5sWSt4DVtS8UqXpi copy

Thank you for your support!

Follow Us!

:(