If you own $HD $LOW $FND or other home improvement & housing linked names like $POOL or $SITE, Zonda is a great resource for industry data
Zonda recently hosted a webinar that had some very interesting data points
Some key notes
zondahome.com/building-produ…
Zonda recently hosted a webinar that had some very interesting data points
Some key notes
zondahome.com/building-produ…
KPI’s like housing starts, home prices, home equity & mortgage rates are seen as classic primary drivers of demand for the industry & names like $HD, $LOW & $FND
Zonda noted real personal income actually has the highest correlation to changes in home improvement spending though
Zonda noted real personal income actually has the highest correlation to changes in home improvement spending though

Due to inflation outstripping wages, real personal income has been in decline y/y now for ~14 mos since 3/22
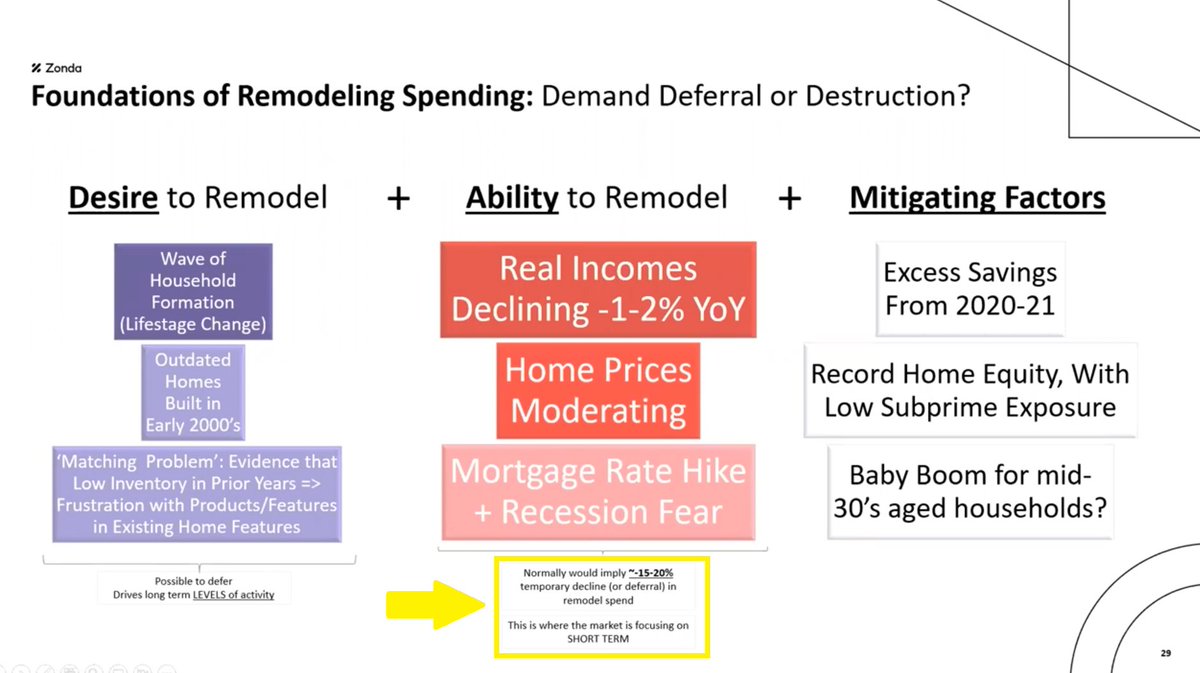
Combined with moderating home prices & increased rates, trends typically would imply a -15-20% decline in remodeling spend based on historic periods, per Zonda’s analysis
Combined with moderating home prices & increased rates, trends typically would imply a -15-20% decline in remodeling spend based on historic periods, per Zonda’s analysis
What we are actually seeing is more of an implied ~MSD decline via ’23 guidance from names like $HD, $LOW, $FND, $POOL and $SITE and ~MSD/HSD declines for building products co’s like $TREX, & $AZEK
So whats going on here? Why is this period different?
So whats going on here? Why is this period different?

By now, everyone is well aware of mitigating factors like record home equity, outdated homes, and demographic secular demand drivers
What many may be missing, and a bigger near-term driver, is a large excess savings buffer generated during 2020-2021
What many may be missing, and a bigger near-term driver, is a large excess savings buffer generated during 2020-2021
Unprecedented stimulus coupled with closures of key sectors like travel, entertainment, dining out, etc. conferred consumers large excess savings over 2020-2021
Zonda est. close to ~$2 trillion in excess savings, equivalent to a full year of normalized savings pre-covid
Zonda est. close to ~$2 trillion in excess savings, equivalent to a full year of normalized savings pre-covid
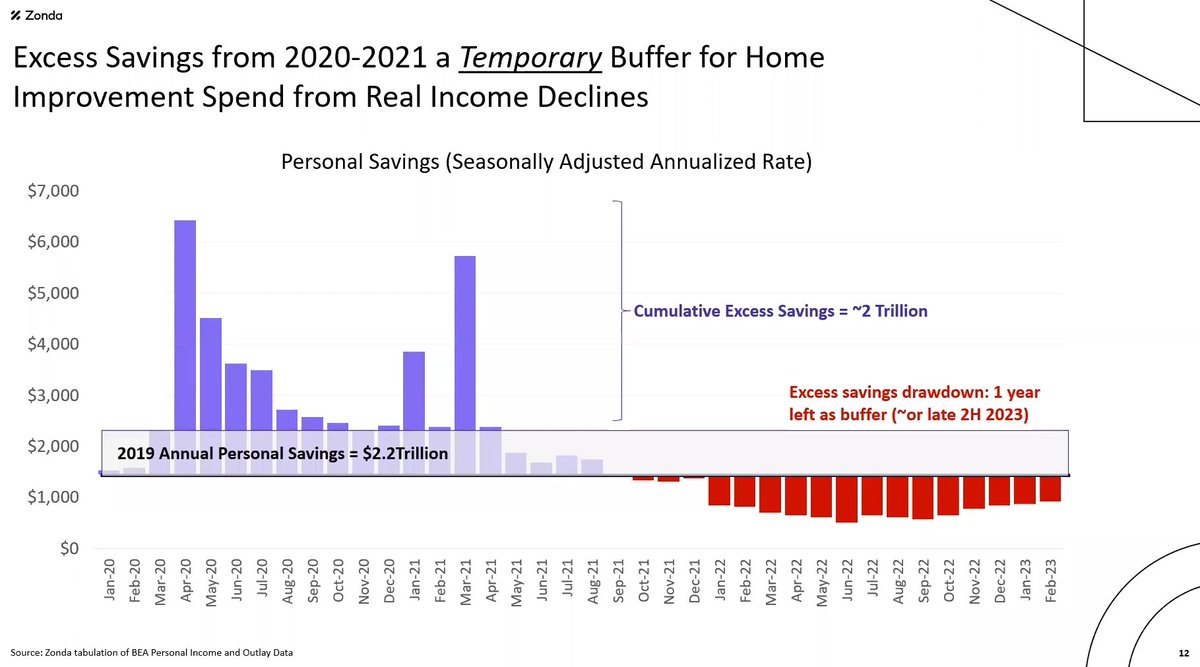
This massive excess savings base is supporting home improvement demand – but is being drawn down as real income declines
About half has been depleted, with ~1yr of buffer left at current real income decline rates – creating risk to 2H’23 and 2024 demand if declines are sustained
About half has been depleted, with ~1yr of buffer left at current real income decline rates – creating risk to 2H’23 and 2024 demand if declines are sustained
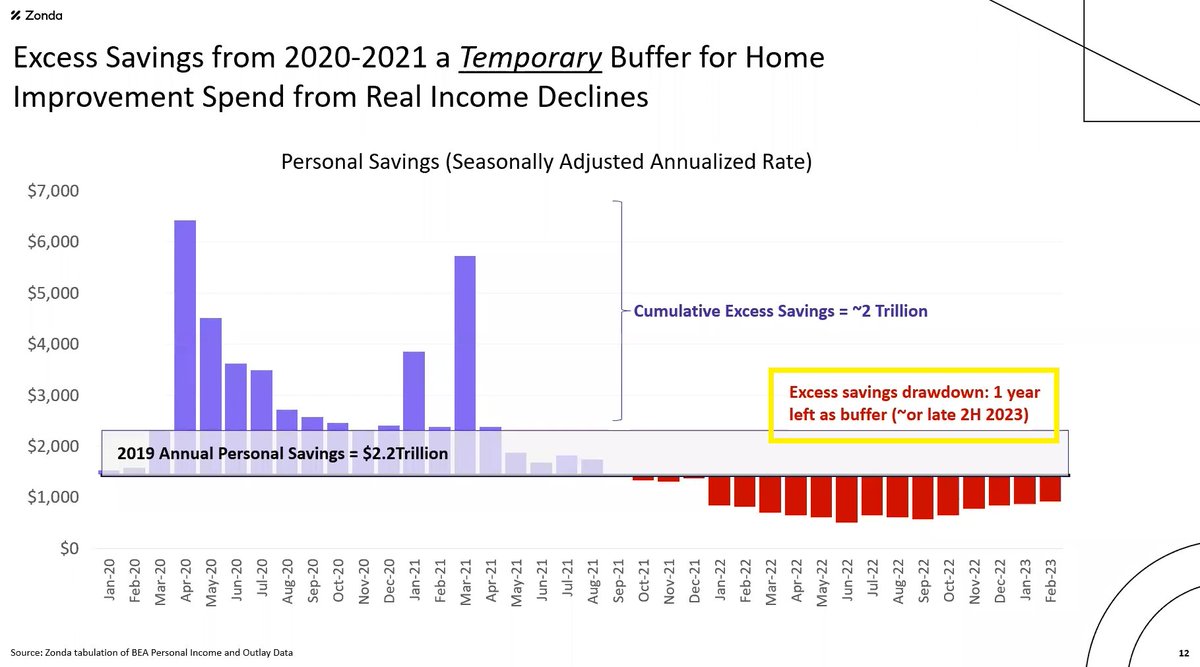
Using FRED data on personal savings, I come up with pretty similar cumulative excess savings vs. 2019 est. on a nominal and inflation adj. basis
See below
See below


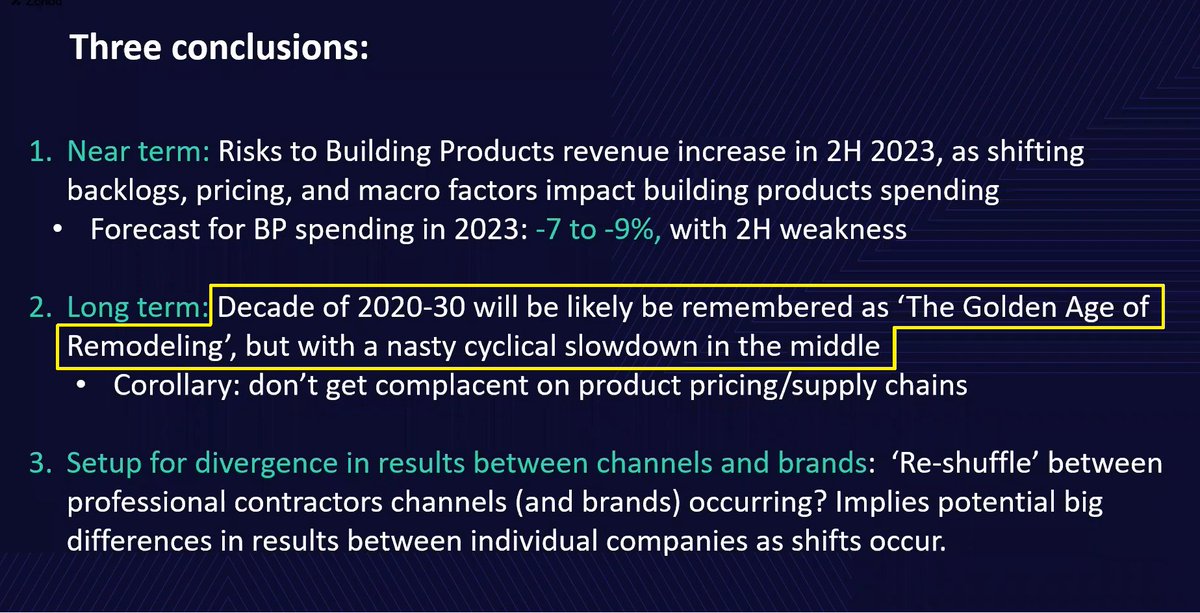
All in, Zonda sees risks mounting for 2H’23 and early 2024
Forecasts a -7-9% decline in building products revenue in 2023 - 2H’23 weighted
(not a home improvement forecast FYI)
Zonda is still highly bullish long term though, expecting a strong recovery following the downturn
Forecasts a -7-9% decline in building products revenue in 2023 - 2H’23 weighted
(not a home improvement forecast FYI)
Zonda is still highly bullish long term though, expecting a strong recovery following the downturn

I really like how Zonda frames the long term outlook for the remodeling space...
“Decade of 2020-30 will likely be remembered as ‘The Golden Age of Remodeling’, but with a nasty cyclical slowdown in the middle”
“Decade of 2020-30 will likely be remembered as ‘The Golden Age of Remodeling’, but with a nasty cyclical slowdown in the middle”
Changing gears to key data points…
Zonda provided some interesting data on projects by homeowner income
We know from JCHS that R&R skews towards higher income consumers (~70% >$80k),
Project income distribution varies very meaningfully though...
Zonda provided some interesting data on projects by homeowner income
We know from JCHS that R&R skews towards higher income consumers (~70% >$80k),
Project income distribution varies very meaningfully though...

Unsurprising high-income mix for areas like pools & decks as you’d expect
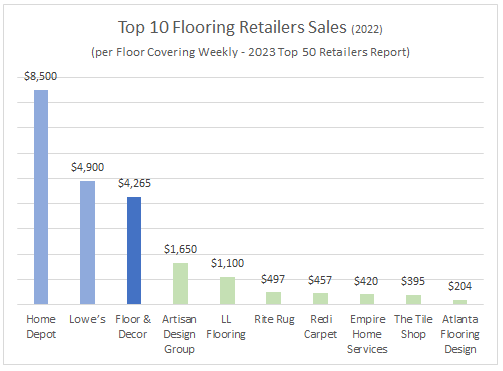
Flooring had much higher low-income mix than I expected though, with Zonda seeing flooring as a key bellwether for the industry due to this & its higher discretionary nature...an important point for $FND
Flooring had much higher low-income mix than I expected though, with Zonda seeing flooring as a key bellwether for the industry due to this & its higher discretionary nature...an important point for $FND

Zonda also is seeing a major shift across the board in ROI for most project categories
Key theme is ROI’s on exterior projects are seeing improvement while interior project ROI’s have declined meaningfully
Good for names like $JHX, bad for names like $FND
Key theme is ROI’s on exterior projects are seeing improvement while interior project ROI’s have declined meaningfully
Good for names like $JHX, bad for names like $FND

Zonda provided some interesting data on contractor backlogs
While public co’s like $FND and $SITE have noted normalization, but still strong backlogs, Zonda saw very material contraction in Q1 that points to a 2H’23 slowdown
While public co’s like $FND and $SITE have noted normalization, but still strong backlogs, Zonda saw very material contraction in Q1 that points to a 2H’23 slowdown

Probably the most valuable chart in the presentation is Zonda’s building products data on brand awareness & commitment, the later a measure of loyalty
A collection of brands like $TREX $AZEK $OC (insulation) & $LII (HVAC) have considerably better awareness & loyalty vs peers
A collection of brands like $TREX $AZEK $OC (insulation) & $LII (HVAC) have considerably better awareness & loyalty vs peers

Zonda’s homeowner NPS data by purchase yr vs. remodeling intent also very intriguing
Data reveals a “matching problem” – an exceptionally tight housing market over '20-'22 resulted in many buyers being unhappy with the home & is driving a higher propensity to remodel vs others
Data reveals a “matching problem” – an exceptionally tight housing market over '20-'22 resulted in many buyers being unhappy with the home & is driving a higher propensity to remodel vs others

In addition, anyone that bought over the last 2-10yrs, despite having high NPS, also has high remodeling intent via substantial home price appreciation and high levels of home equity
Zonda sees these two groups driving the bulk of remodeling demand
Zonda sees these two groups driving the bulk of remodeling demand
Zonda had an important call out on big boxes $HD & $LOW too
Both benefited over ’20-’22 from supply chain constraints & record demand, capturing many pro customers as typical pro suppliers struggled to source inventory
Both benefited over ’20-’22 from supply chain constraints & record demand, capturing many pro customers as typical pro suppliers struggled to source inventory

Pro’s acquired tended to be smaller & lower performing contractors though
In Q1 these pro's are seeing the steepest volume declines & pricing pressure in their businesses
$LOW appears to be getting hit the hardest
In Q1 these pro's are seeing the steepest volume declines & pricing pressure in their businesses
$LOW appears to be getting hit the hardest

Changing gears, on home construction – Zonda has proprietary data around conversion rates
You'd think with mortgage rates up conversion would be down – you’d be wrong – builder traffic conversion rates are still well above 2019 levels and remain comparable to 2020-2022 levels
You'd think with mortgage rates up conversion would be down – you’d be wrong – builder traffic conversion rates are still well above 2019 levels and remain comparable to 2020-2022 levels

In addition to conversions, and despite a material decline in starts – the backlog of single and multifamily housing in construction is massive…
Total at the highest ever recorded driven by record multifamily construction
Total at the highest ever recorded driven by record multifamily construction

All in, came away really impressed with Zonda’s webinar
Provided a wide array of data and insights – a lot more than covered in this thread
I highly recommend those interested to take the time to listen to the entire webinar...link below
zondahome.com/building-produ…
Provided a wide array of data and insights – a lot more than covered in this thread
I highly recommend those interested to take the time to listen to the entire webinar...link below
zondahome.com/building-produ…
• • •
Missing some Tweet in this thread? You can try to
force a refresh