Jeff Berardelli Profile picture
Jun 8 8 tweets 2 min read Twitter logo Read on Twitter
Global Sea Surface Temperatures are at record levels, and not just by a little. The North Atlantic is a whole 1 degree F above record territory. From a meteorologist perspective there are few words to describe how out of bounds that is. So what is going on?? Thread...
Lots to discuss. There are a few marine heat waves you can see on this map. North Pacific. Equatorial Pacific. Tropical Atlantic. And NE Atlantic. Let's start with the Equatorial Pacific because that is the most obvious... El Nino.
There's a natural redistribution of waters in both basins every couple/ few years. Oscillations. These are normal. When the "relative" warmest water gathers around the Equator, esp across the Tropical Pacific because it is so large, you end up with large departures from normal..
It’s similar in the Atlantic. The basin is larger in the Tropics. And this year natural cycles have coincidently redistributed the relative warmest water into the Tropical Atlantic. Again causing large departures from normal. The Atlantic pattern is termed a +AMO but there more..
While these natural cycles act on a year to year basis, this is happening on top of human influence. Over decades ocean temps have warmed generally by around 1.5 to 2 degrees F. This is due mainly to greenhouse warming, but also the reduction of air pollution esp in Atlantic…
The oceans absorb just less than 90% of excess heat due to greenhouse warming. So they have been significantly heating. Also, on the man-made front, let’s talk about pollution and it’s impact…
After the Clean Air Act in the 1970s the air above the Atlantic has gradually cleared. That’s enabled extra sunlight to be absorbed and helped warm as well. Add to that, in 2020 ships were forced to significantly limit Sulphur emissions. Again limiting pollution’s cooling effect.
Lastly you need to consider weather. Sometimes resilient patterns set up that warm the underlying ocean. Bottom line: a multitude of factors have compounded to result in unprecedented ocean temps. But as long as we continue to warm the climate, the baseline will continue to rise.

• • •

Missing some Tweet in this thread? You can try to force a refresh
 

Keep Current with Jeff Berardelli

Jeff Berardelli Profile picture

Stay in touch and get notified when new unrolls are available from this author!

Read all threads

This Thread may be Removed Anytime!

PDF

Twitter may remove this content at anytime! Save it as PDF for later use!

Try unrolling a thread yourself!

how to unroll video
  1. Follow @ThreadReaderApp to mention us!

  2. From a Twitter thread mention us with a keyword "unroll"
@threadreaderapp unroll

Practice here first or read more on our help page!

More from @WeatherProf

Jun 9
Great animation from NOAA which shows how this El Nino has developed. Warm anomalies start as an east-based event and then those anomalies grow westward. Want to understand how this changes the atmosphere? NOAA has a couple more useful visuals 1/
In a "normal" or neutral year (no EL Nino and No La Nina) you'd expect the "relative" warmest water to be over the western Pacific near Indonesia. That warm water means rising air and thunderstorms there and sinking air in the E. Pacific. Over the Atlantic the air rises. Image
In El Nino the relative warmest water moves into the central / eastern Pacific. Air rises there and sinks both to the west and east. Western Pacific ends up dry and Atlantic has increased sinking air and wind shear. "Typically" that reduces hurricanes in Atlantic. Image
Read 4 tweets
Jun 8
What is happening is dumbfounding. It may be a few factors piling on top of one another (not just pollution reduction), but holy cow.
It's worth mentioning one likely important factor. The Atlantic has redistributed it's warm anomalies since last summer when the warmest water relative to normal was in the far North Atlantic. This season the warmer water has moved into the tropics which is more expansive... 2/
This is considered by many to be a natural fluctuation of the Atlantic Multidecadal Oscillation +AMO this year. The +AMO allows for warm water to be expansive basin wide near the Equator which adds more warmth to the mix.
Read 5 tweets
Jun 6
Life-threatening heat today in Puerto Rico so hot that some meteorologists are astonished. And more of the same to come this week. Heat index numbers as high as 115-125 today!! So what is going on? There are many factors, so let's dig in... thread 1/ Image
A pocket of Saharan dust is right over the island, leading to clear weather, helping boost temperatures. But there's a lot more.... Image
Zoom out and we see a culprit. A large/ intense high (heat dome) forming just east of Puerto Rico, unusually far south, leading to a SE flow and drawing up high humidity. But also record warm Tropical Atlantic water temperatures helping boost dewpoints... Image
Read 10 tweets
May 10
Remarkable!! All areas in magenta indicate a record breaking mid-upper level (500mb) ridge by the weekend. This is an immense heat dome maxing out at 4.2 standard deviations (sigma) from the mean. A ridge magnitude on par with June 2021🧵
Now, the 2021 heatwave was late June and this is mid May. Huge difference in terms of actual surface temperatures. It will still be record hot (~40+ degrees F above normal in spots) but we won’t have the widespread life threatening heat we did back then…
After the 2021 Pacific NW heatwave a few papers were published. The conclusion: it was basically impossible without climate change. That heatwave was found to be a 1-in-1000 year event in TODAY’S climate… and 150X less likely in preindustrial times. Do the math on that…
Read 8 tweets
Feb 16
New paper on Thwaites (Doomsday Glacier) finds melting rates under the base of the ice shelf are lower than models would suggest due to stratification, yet the grounding line is retreating fast anyway. Thus you don't need rapid base melting for retreat... 1/
Also, models don't capture basal melting rates well thus projections fall short. It's clear there is lots more to learn and to incorporate into models. Animation from my team at @WFLA New Paper here: nature.com/articles/s4158…
The animation was build for a paper released last September. This animation simply helps explain what the grounding line is and how, if it lifts off the sea floor, it can raise sea levels. Here's that story. wfla.com/weather/climat…
Read 5 tweets
Sep 28, 2022
#Ian is now at 155 mph, 1 mph shy of a cat 5. Only 4 US storms have made landfall that strong. It may be taking a similar track to Charley, but it’s no Charley. Ian’s eye is 40mi wide, hurricane winds are 75mi wide. Dwarfs Charley’s 5 mi eye & 30mi hurr winds. ⁦@WFLA⁩ 1/
Because of the girth of the eye wall(~75mi) the reach of sustained 74 mph winds (gusts to 100) will reach into Northern Sarasota county. Hurricane gusts to Bradenton and the Sunshine Skyway and far Inland into Arcadia, Wauchula and into Polk Co. Bartow, Lake Wales. 1/
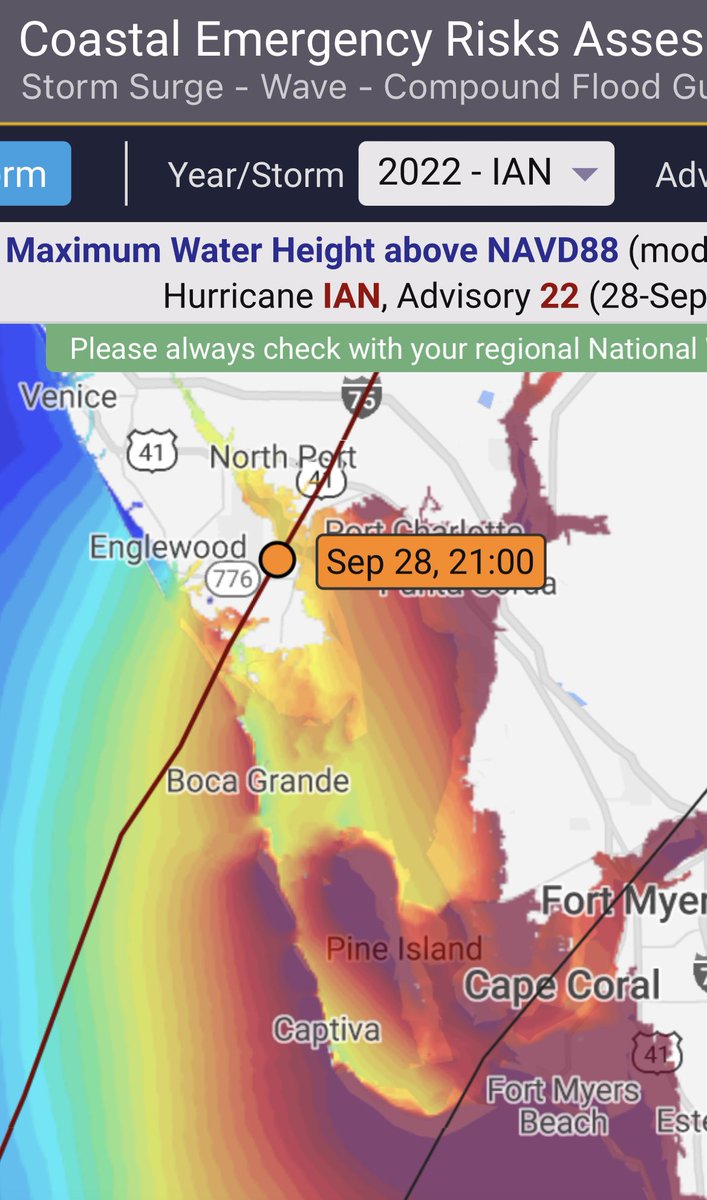
Charley was not a major surge maker. #Ian’s surge is forecast upto 16 feet south of Englewood around Boca Grande, Captiva and into Charlotte Harbor. Please, please make good decisions.
Read 4 tweets

Did Thread Reader help you today?

Support us! We are indie developers!


This site is made by just two indie developers on a laptop doing marketing, support and development! Read more about the story.

Become a Premium Member ($3/month or $30/year) and get exclusive features!

Become Premium

Don't want to be a Premium member but still want to support us?

Make a small donation by buying us coffee ($5) or help with server cost ($10)

Donate via Paypal

Or Donate anonymously using crypto!

Ethereum

0xfe58350B80634f60Fa6Dc149a72b4DFbc17D341E copy

Bitcoin

3ATGMxNzCUFzxpMCHL5sWSt4DVtS8UqXpi copy

Thank you for your support!

Follow Us on Twitter!

:(