In the early 1980s, Joel Greenblatt authored a paper on buying stocks selling below liquidation value and ran some backtests with impressive results.
He named it 'How the Small Investor Can Beat the Market'.
Here are the key takeaways 🧵
He named it 'How the Small Investor Can Beat the Market'.
Here are the key takeaways 🧵

1/ Greenblatt did not believe in the efficient market hypothesis, a common belief at the time, and felt that this shared belief limited investors.
"Since this theory concludes that bargain purchases are impossible, academics argue attempts to outperform the market are futile".
"Since this theory concludes that bargain purchases are impossible, academics argue attempts to outperform the market are futile".

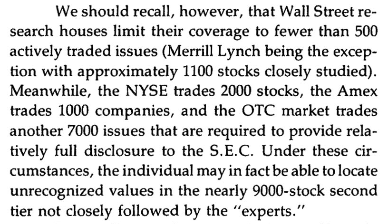
2/ While the numbers may differ today, institutions still neglect certain stocks; because many of them are too small or illiquid.
For this reason, Greenblatt believed there will always be unrecognised value in the market.
For this reason, Greenblatt believed there will always be unrecognised value in the market.
3/ His paper sought to combine Benjamin Graham's approximation of liquidation value (below) with the PE ratio. This process was intended only to be a rough screening device to sort out likely prospects from the thousands available.
He excluded firms with TTM losses.
He excluded firms with TTM losses.

4/ He constructed four unique portfolios and compared their performance to that of the OTC and Value Line indexes across 18 four-month periods from 1972 to 1978.
Variables included price/liquidation value and PE.
Variables included price/liquidation value and PE.

5/ An initial $100 investment across the OTC and Value Line indexes would return $88 and $79, respectively.
After six years, portfolios 1 through 4 returned a range between $248 and $517.
After six years, portfolios 1 through 4 returned a range between $248 and $517.

6/ The portfolio with the lowest value with respect to PE and LV was found to be the highest-performing vehicle.
Portfolios with floating PEs beat the indices but underperformed those with fixed ratios.
Portfolios with floating PEs beat the indices but underperformed those with fixed ratios.

7/ We can assume that the PE value was considerably higher for portfolios 1 and 2, because Triple-A yields ranged from 7% to 9% during the period.

8/ Portfolio 1 had, collectively, the highest values for LV (≤ 1.0) and PE (5.5 to 7) and performed the worst. The study suggests that searching for profitable stocks that have an LV ≤ 0.85 and PE ≤ 5 is the most attractive fishing spot for stock pickers.
9/ Limitations to the study included;
• Reconciling returns
• Dividends & fees
• Sample period
• Sample size
• Market cap threshold
• Portfolio size
E.g, the avg # of stocks in the sample portfolios was ~15. Concentrated by some people’s standards.
• Reconciling returns
• Dividends & fees
• Sample period
• Sample size
• Market cap threshold
• Portfolio size
E.g, the avg # of stocks in the sample portfolios was ~15. Concentrated by some people’s standards.
10/ Why did it work?
The criterion produced results based on the “large 2nd tier of stocks” that are forgotten and inefficiently valued by the market.
The study sought to exploit stocks that were undervalued and protected by large asset values and strong balance sheets.
The criterion produced results based on the “large 2nd tier of stocks” that are forgotten and inefficiently valued by the market.
The study sought to exploit stocks that were undervalued and protected by large asset values and strong balance sheets.

11/ While Greenblatt's paper is unlikely to work as well today, the fact that a retail investor can exploit underexamined pockets of the market remains true, decades later.
Get screening!
Get screening!

• • •
Missing some Tweet in this thread? You can try to
force a refresh