
Technical Analysis 101🎯
6 Powerful & Simple Price action strategies...📉
...to easily spot the Beginning/End of an
UpTrend/Downtrend in all timeframes & Markets!💹
Ready to Learn?🤓
Let’s go…🧵
#Learnwithtrendlineinvestor
6 Powerful & Simple Price action strategies...📉
...to easily spot the Beginning/End of an
UpTrend/Downtrend in all timeframes & Markets!💹
Ready to Learn?🤓
Let’s go…🧵
#Learnwithtrendlineinvestor

1 -> A Trend Persists until Its Reversal Is Indicated
- In Dow Theory, a trend is assumed to persist until there is evidence to the contrary
- Trend changes are identified by a penetration of a previous significant High or Low
- In Dow Theory, a trend is assumed to persist until there is evidence to the contrary
- Trend changes are identified by a penetration of a previous significant High or Low
2 -> How to identify the end of an uptrend?📈
There are basically 3⃣ types of reversal formations that will signal a change in the direction from uptrend to downtrend
✅ Failure Swing
✅ Non-Failure Swing
✅ Double Top sell
Let's look at them in detail!👀
Save this Image👇
There are basically 3⃣ types of reversal formations that will signal a change in the direction from uptrend to downtrend
✅ Failure Swing
✅ Non-Failure Swing
✅ Double Top sell
Let's look at them in detail!👀
Save this Image👇

Fancy watching a video explanation rather than reading?😀
Watch this video where I explain all of the 'Top Reversal formations'!👀
If not, read on!📚
Watch this video where I explain all of the 'Top Reversal formations'!👀
If not, read on!📚
2.1 -> Failure Swing Reversal
- Price needs to make a high
- followed by a 2nd high which should be a lower high
- Price should now break the Swing Low between these two highs thus generating a Sell signal & signalling the end of a long term uptrend
- Price needs to make a high
- followed by a 2nd high which should be a lower high
- Price should now break the Swing Low between these two highs thus generating a Sell signal & signalling the end of a long term uptrend

2.2 -> Non-failure Swing Reversal
- Price makes a high & then a higher high
- Price should now break the previous swing low, creates a lower low
- Price rises again but fails to cross the previous higher high, creates a lower high
- Price breaks the lower low to generate a sell
- Price makes a high & then a higher high
- Price should now break the previous swing low, creates a lower low
- Price rises again but fails to cross the previous higher high, creates a lower high
- Price breaks the lower low to generate a sell

2.3 -> Double top Reversal
- Price makes a two similar highs
- Price should now break the swing low between the highs thus generating a sell signal
Depending on the position size in the trade, one can wait for a close or sell immediately when price crosses swing low
- Price makes a two similar highs
- Price should now break the swing low between the highs thus generating a sell signal
Depending on the position size in the trade, one can wait for a close or sell immediately when price crosses swing low

3 -> How to identify the end of a downtrend?
Again, there are 3⃣ types of reversal formations that signal a trend change from down to uptrend
✅ Failure Swing
✅ Non-Failure Swing
✅ Double Top sell
Yes, the names are the same!
Let's look at them in detail👀
Save this Image👇
Again, there are 3⃣ types of reversal formations that signal a trend change from down to uptrend
✅ Failure Swing
✅ Non-Failure Swing
✅ Double Top sell
Yes, the names are the same!
Let's look at them in detail👀
Save this Image👇
Watch this video where I explain all these 3 bottom reversal formations!
If not, read on!📚
If not, read on!📚
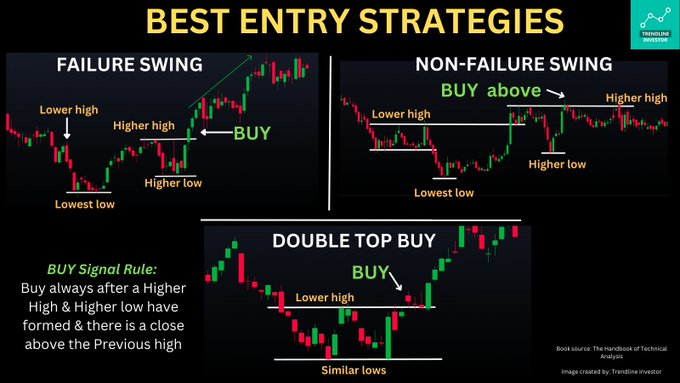
3.1 -> Failure Swing Reversal
- Price needs to make a Low & rise
- Price should drop again but shouldn't cross previous low - creating a higher low
- Price should now break the high between these two lows thus generating a Buy signal & signalling the end of a long term downtrend
- Price needs to make a Low & rise
- Price should drop again but shouldn't cross previous low - creating a higher low
- Price should now break the high between these two lows thus generating a Buy signal & signalling the end of a long term downtrend

3.2 -> Non-failure Swing Reversal
- Price makes a low & then a lowest low
- Price should now go straight up above the previous lower high creating a Higher high
- Price should now drop to create a Higher low
- Price should break the Higher high to generate a Buy Signal
- Price makes a low & then a lowest low
- Price should now go straight up above the previous lower high creating a Higher high
- Price should now drop to create a Higher low
- Price should break the Higher high to generate a Buy Signal

3.3 -> Double bottom Reversal
- Price makes a two similar Lows
- Price should now break the swing high between the lows thus generating a Buy signal
Stop loss for all formations will be either Swing high or Swing low depending on Uptrend/Downtrend
- Price makes a two similar Lows
- Price should now break the swing high between the lows thus generating a Buy signal
Stop loss for all formations will be either Swing high or Swing low depending on Uptrend/Downtrend

4 -> Pro-tip for investing/Trading
- The longer the timeframe the more stronger the signals are
- For Swing/Positional trading use Daily charts
- For Investing use Weekly/Monthly charts
- The longer the timeframe the more stronger the signals are
- For Swing/Positional trading use Daily charts
- For Investing use Weekly/Monthly charts
Learnt something? If yes, please👇
1. Retweet the first tweet
2. Follow @dmdsplyinvestor
3. Subscribe to my YouTube channel for more content! youtube.com/c/TrendlineInv…
1. Retweet the first tweet
https://twitter.com/dmdsplyinvestor/status/1667387643162681344?s=20
2. Follow @dmdsplyinvestor
3. Subscribe to my YouTube channel for more content! youtube.com/c/TrendlineInv…
• • •
Missing some Tweet in this thread? You can try to
force a refresh


