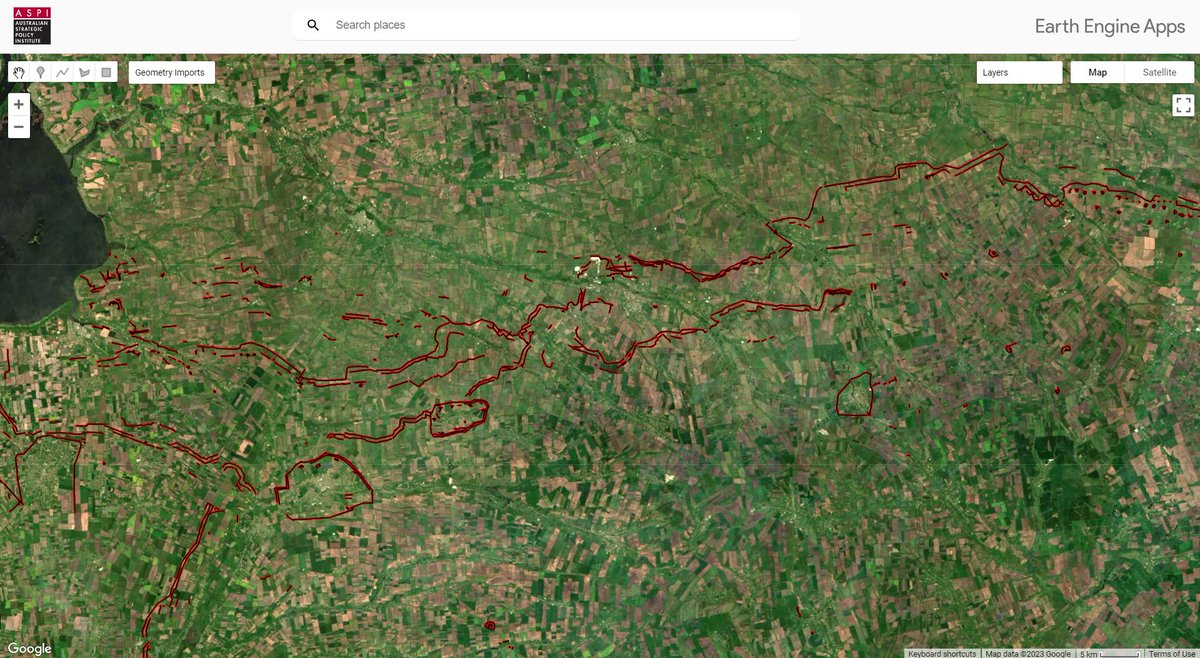
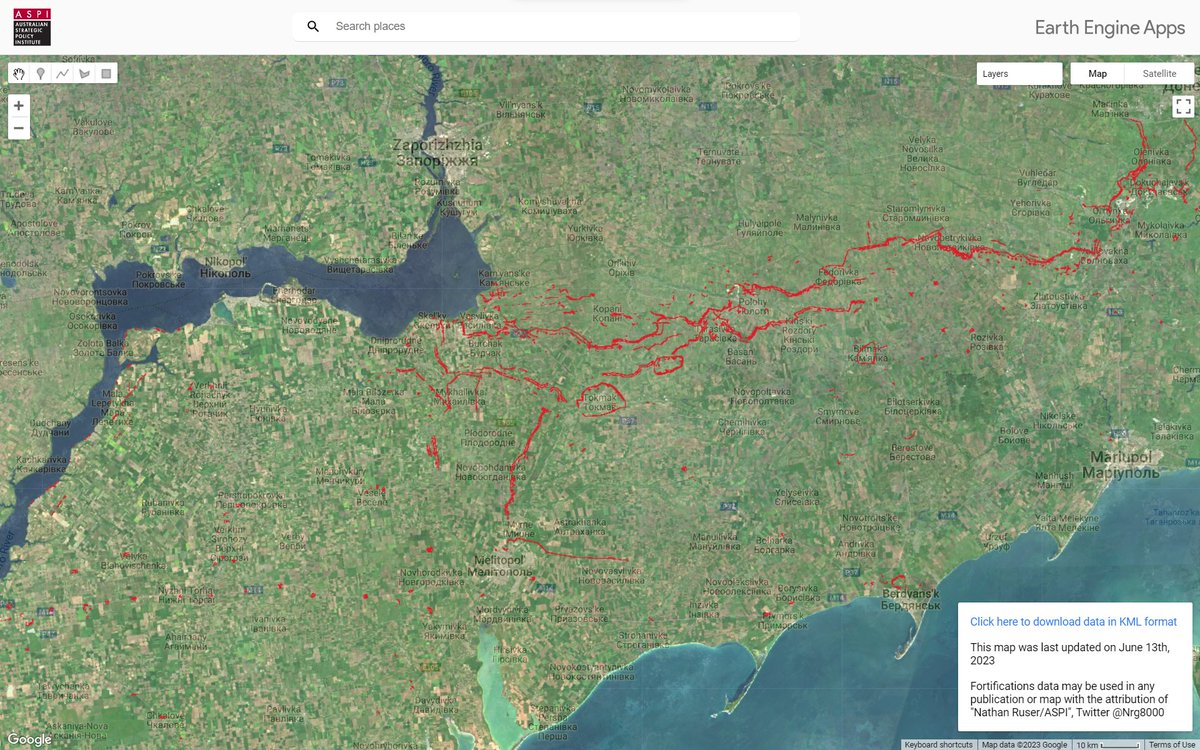
🧵I've updated this fortifications data to include all Southern occupied Ukraine (Donetsk city - Crimea - Kinburn) with 2,389 fortifications traced from new satellite imagery. A download link is included. nrg800.users.earthengine.app/view/russianfo…
So what does this mean for the Ukrainian offensive?
Obviously, the purpose of this data is to provide insight to people far more knowledgable in the military tactics and strategy than me, so I won't focus too much on my armchair general takes, but I do want to share a few quick things that mapping this mas made me realise.
These fortifications look formidable. Russia has clearly invested SIGNIFICANT time and manpower into building a robust and comprehensive main-defensive line behind the front, and these provide challenges to Ukraine that it has not faced before in its offensive operations.
A lot of Ukrainian offensive operations so far have relied on manouver and infantry pushes, fighting in undermanned weakspots and isolating fortified locations & forcing withdraw or risk capture. Infantry-led pushes involving small-position CQB has been prevelent.
(This better characterises the Kharkiv offensive rather than the Kherson offensive, but similar trends have occured throughout - to the extent of the meme that 'tanks are obsolete' that we hear shouted sometimes)
That doesnt hold true here. The main defensive line consists of multiple layers of anti-tank trenches, anti-tank teeth, minefields & infantry trenches. These will require actual engineering to cross, with mine-clearing vehicles, bulldozers & whatever else necessary at the front.
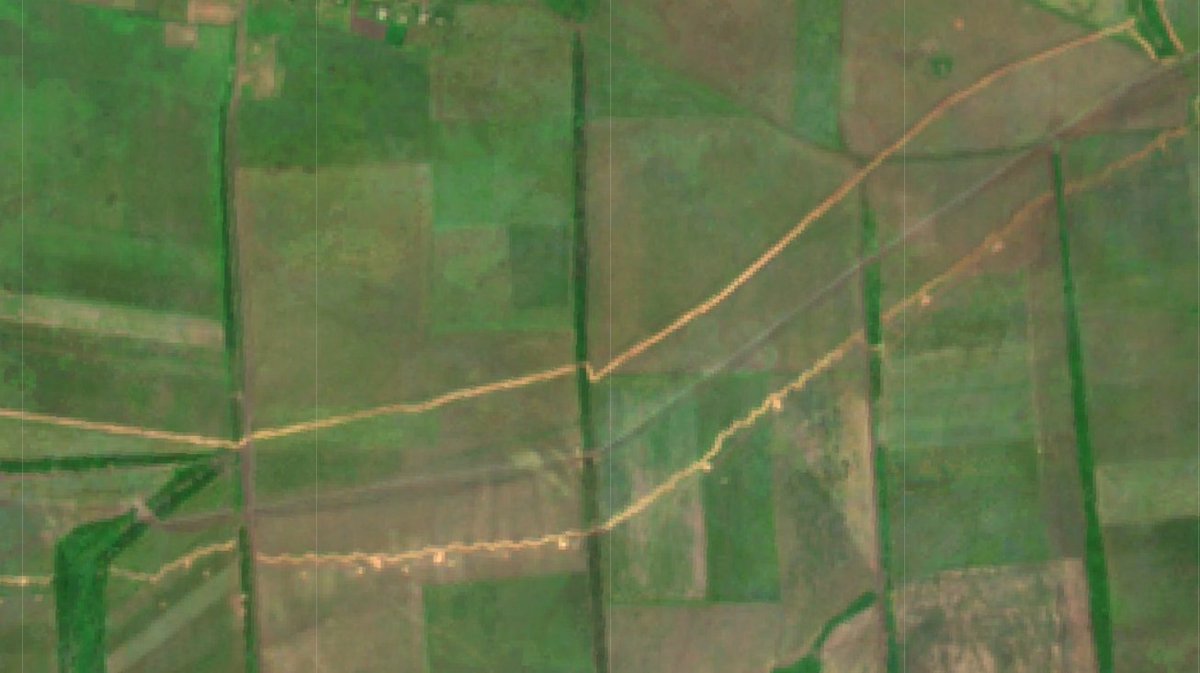
This doesn't just require reaching the front, manouvering and assaulting small positions, but reaching and securing the main line to the extent that support elements can approach, likely with limited control of the other-side and with Russia's improved artillery to deal with.
• • •
Missing some Tweet in this thread? You can try to
force a refresh
While Ukraine's offensive in Zaporizhia is starting to ramp up, Russia has spent the last 2 months fortifying defensive lines across the entire oblast.
Ive made an interactive map that shows the most recent satellite imagery and these lines. nrg800.users.earthengine.app/view/russianfo…
Download below
The satellite imagery shows land over the past two months (since April 15th). Overall, around 1,000 fortification lines have been mapped in the area. These certainly present a challenge to Ukrainian forces trying to move through the landscape and attack in depth.
The fortification data can be freely downloaded (incl for Google Earth) here: mega.nz/file/LVZnQJoA#…
Anyone is free to use it in any map or publication with attribution to Nathan Ruser/ASPI.
I have tried to be comprehensive, but don't consider this a complete survey.
This is incredible, since the collapse of Kakhovka Dam, you can actually see (in @PlanetImagery) the baymetry reflected in the surface currents and flow along with the old path of the river before it was dammed in 1956!
If anyone knows why this is happening, super fascinated.
@PlanetImagery It is also evident in Sentinel-2 imagery, though less clearly.
I'm sure it must be some form of how old stagnant water is mixing with the surface flow? but very interested in getting a better idea.
@PlanetImagery Here's Harel talking about some of the possibilities on an early post of mine (that I deleted because it was worded as though you actually were seeing the bathymetry not just it reflected in the currents)
Using satellite imagery to gauge the flood-level along the Dnipro River on June 7th, this map shows an estimate of the flood depth on the 7th.
The satellite imagery used to estimate the flood was centred on Kherson, and uncertainty grows as you get further away from there.
, georeferenced the images, plotted points at the edge of the floodwaters to create a flood-elevation surface and compared that to FABDEM elevation models.
@planet@Mike_Eckel@kromark As the water is rapidly flowing down the channel, the flood-level elevation wont be consistant down the river, especially as it spreads out closer to the sea, because of this areas far away from the towns mapped shouldn't be considered at all exact. I'll try and get more imagery.
OK, ISW is becoming a major problem in the media ecosystem. This assessment is just a hunch from their mapping team (one that I disagree with), and yet their role in providing maps will see this (bad) opinion laundered as fact by many journalists who print what they say verbatim.
You can have reasonable theories that this was a false flag, I disagree for the simple fact that it makes the Kremlin look inept and weak as hell. But the point is, it's irresponsible to throw these largely baseless theories out there knowing how they'll be consumed.
And the other point is (and this is coming from someone who has mapped Ukraine in meticulous detail), the people you don't want making this assessment and putting it out there are the people who's only job is to map the situation in meticulous detail.
If you need a reminder that by 2023 we're living in the future, here's a video of Burmese resistance fighters dropping bombs from drones on fascist coupist military cronies to high-vibe electro music (specifically @1N1KO).
Don't worry Iniko, these are the good guys.
@1N1KO Fighting against a genocidal and murderous occupying coup force in the Myanmar Ricefields, but still keeping up with your spotify New Releases playlist (this song came out less than a month ago). Very based.
As someone who spent years having to listen to nasheeds (don't jump on me nasheed lovers) in videos like this, often coming from ISIS, Myanmar and Ukraine have really shaken it up, both in soundtrack, and in coming from groups you can actually support.
This study's getting a bit of attention, but reading through it, it is deeply deeply problematic, & I would consider the findings invalid. It is built on a dataset that inflates the reliability of recent sightings (2 in 2005 were scored 5/5 reliabile). Bad data in, bad data out.
The study runs its probability models on verified sightings and comes out with a mean extinction date of 1937 (95% ci: 1934-1938), but once they add the ludicrous unconfirmed sightings in the database (where the headline figure comes from) it becomes 2011 lmao.
I particularly like the model they ran which incl unconfirmed records to an arbitrary 1950 cut off. Which showed the mean extinction date as 1951. So clear that the weight of this headline recent figure is built directly on arbitrary and imo invalid unconfirmed sightings.