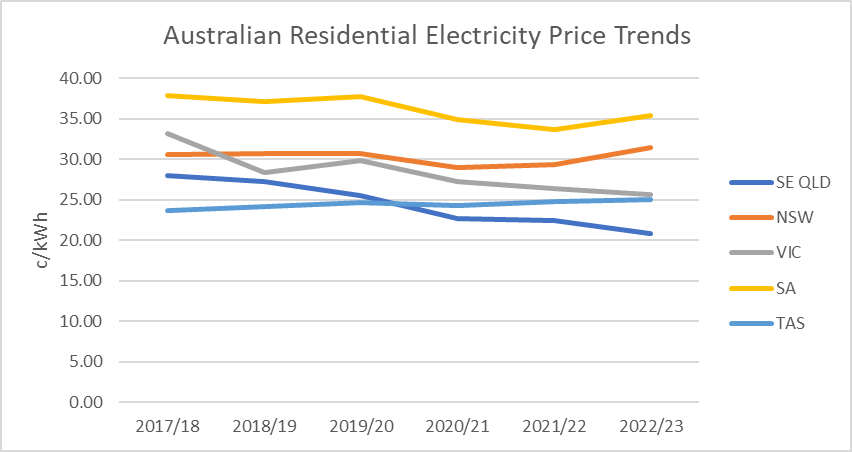
A thread on why Sth Australia has the most expensive electricity on Australia’s NEM.
Short answer: because it has a very ‘peaky’ demand, driven by high electricity use in summer heatwaves. This in turn drives high network costs, particularly on the distribution network. (1/7)
Short answer: because it has a very ‘peaky’ demand, driven by high electricity use in summer heatwaves. This in turn drives high network costs, particularly on the distribution network. (1/7)
Let’s look first at wholesale electricity prices.
SA has long had the highest prices on the NEM. Some claim this is due to its high wind & solar penetration, ~70% in 2022-23. But it had high prices long before RE made a meaningful contribution to SA’s electricity (RE<1% in 2007).
SA has long had the highest prices on the NEM. Some claim this is due to its high wind & solar penetration, ~70% in 2022-23. But it had high prices long before RE made a meaningful contribution to SA’s electricity (RE<1% in 2007).
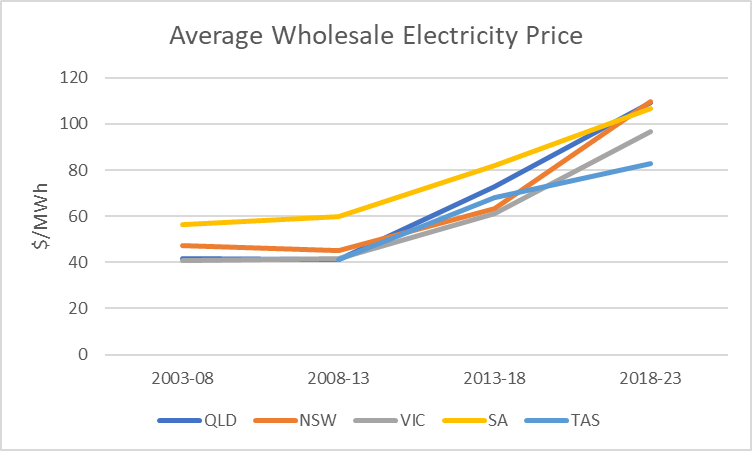
This is a good lesson on correlation does not equal causation. High electricity prices helped attract renewable developers to the state. ie. high prices caused high RE, not the other way round.
In turn, all the built RE helped alleviate those high prices (3/7)
In turn, all the built RE helped alleviate those high prices (3/7)

OK, so SA has long had high wholesale electricity costs. What else is important?
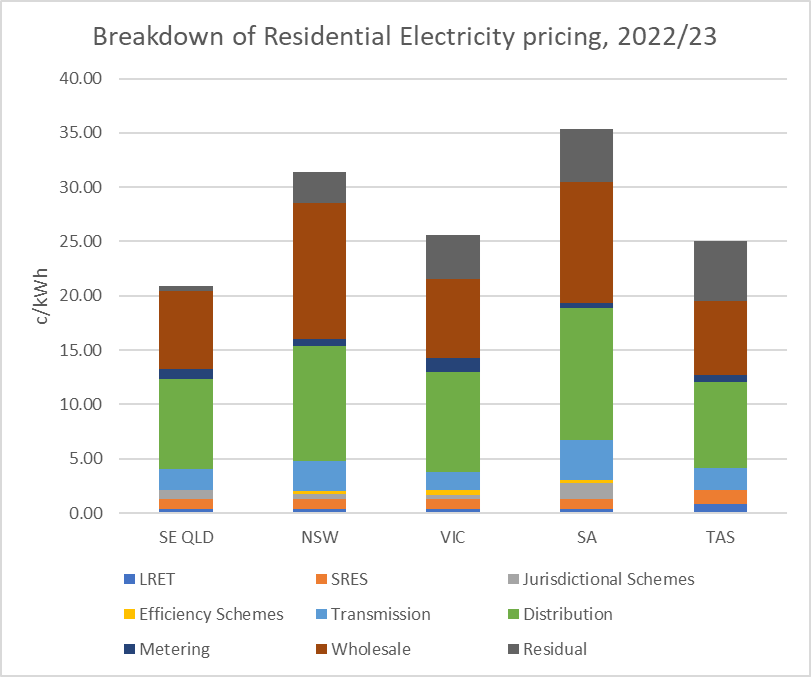
The following figure shows that along with the previously discussed wholesale costs, distribution network costs represent an equally large component (4/7)
The following figure shows that along with the previously discussed wholesale costs, distribution network costs represent an equally large component (4/7)
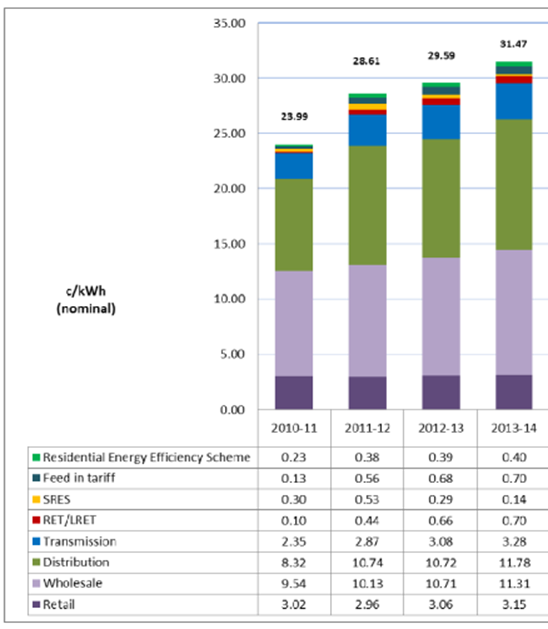
South Australia had a very large increase in distribution network costs between 2010/11 & 2013/14. As the AEMC noted at the time, this was driven by increases in peak demand caused by air-conditioner use during summer heatwaves (5/7)

But other Australian states are also subjected to high air conditioner load in summer. Is SA unusual in this regard? As the following chart indicates, yes SA is quite unique. It’s peak demand is over twice average demand, a much higher ratio than in the other states (6/7)

In summary, SA’s electricity price is higher than the other NEM states. This is due primarily to its peaky electricity demand driven by high air conditioner use during summer heat waves. This drives up its network costs, particularly for the distribution network (end)
One additional tweet. This article from 2018 also has some good analysis on why SA's electricity is expensive. In addition to what I mentioned, it also discusses SA's lack of cheap & nasty coal, no hydro & heavy reliance on gas. solarquotes.com.au/blog/south-aus…
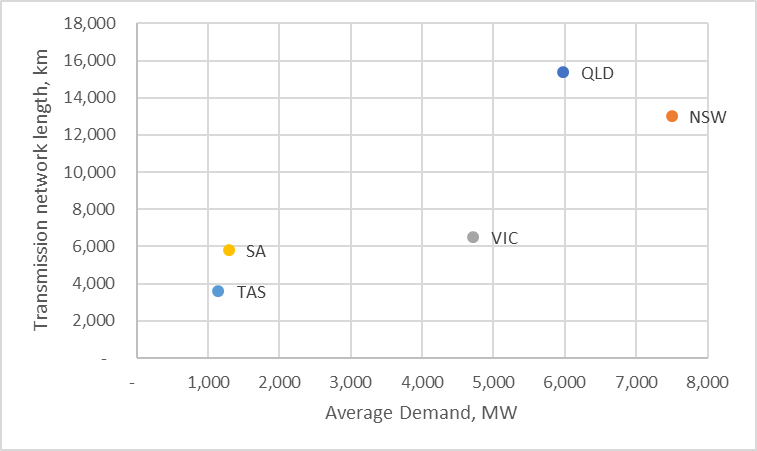
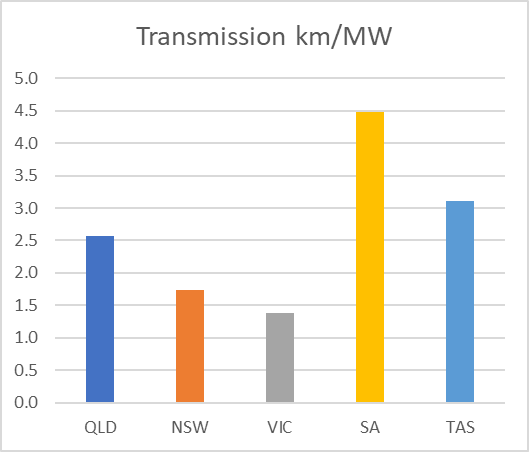
One more tweet: SA has a lot of transmission network relative to its demand. That explains a lot of why its transmission costs are high, along with it 'peaky' demand profile. But as explained in tweet #3, transmission costs are substantially lower than distribution costs.
This article has an interesting discussion about why night-time off-peak rates can be cheaper than day-time, despite cheaper day-time wholesale prices.
reneweconomy.com.au/im-buying-an-e…
reneweconomy.com.au/im-buying-an-e…
The other states can learn from the ACT and how its Government has shielded its residents from electricity prices volatility:
https://twitter.com/DavidOsmond8/status/1666583685825712128
Another reason SA has high distribution costs: it has about 50% more powerline poles than the national average.
https://twitter.com/jarrodf_/status/1748860520386723929
• • •
Missing some Tweet in this thread? You can try to
force a refresh