David Osmond Profile picture
Renewable Engineer On Bluesky: davidosmond Love renewables, EVs & energy efficiency, the outdoors, running & cycling. Views are my own.
2 subscribers
Jan 2 9 tweets 4 min read
A thread on flexible generation on Australia's NEM.
Historically, flexible gas & hydro generators have complemented less flexible coal, to ensure supply can meet demand.
In the future, flexible generation will be dominated by batteries & they'll be also used to firm PV & wind.
/1 Image 
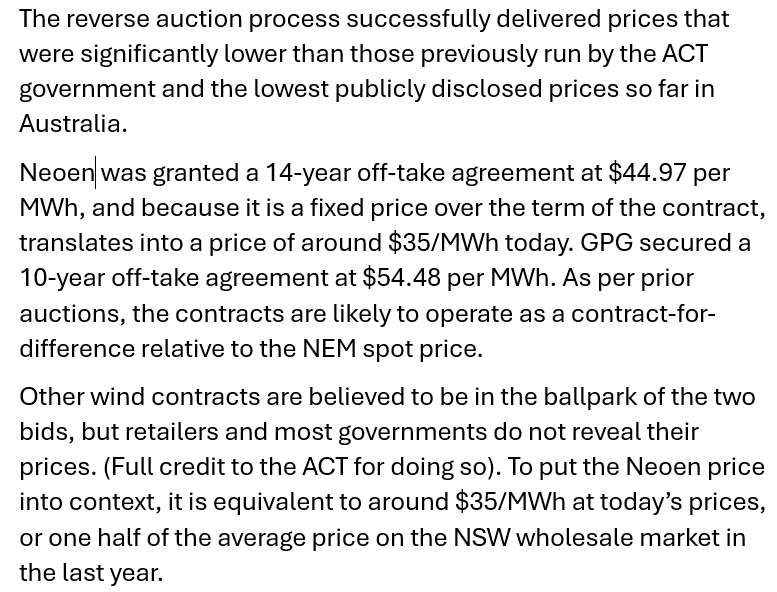
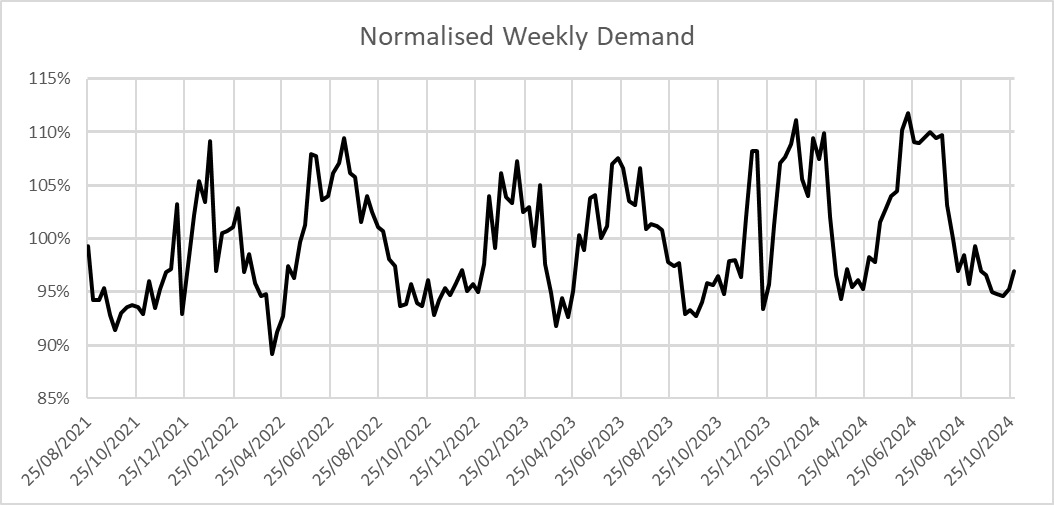
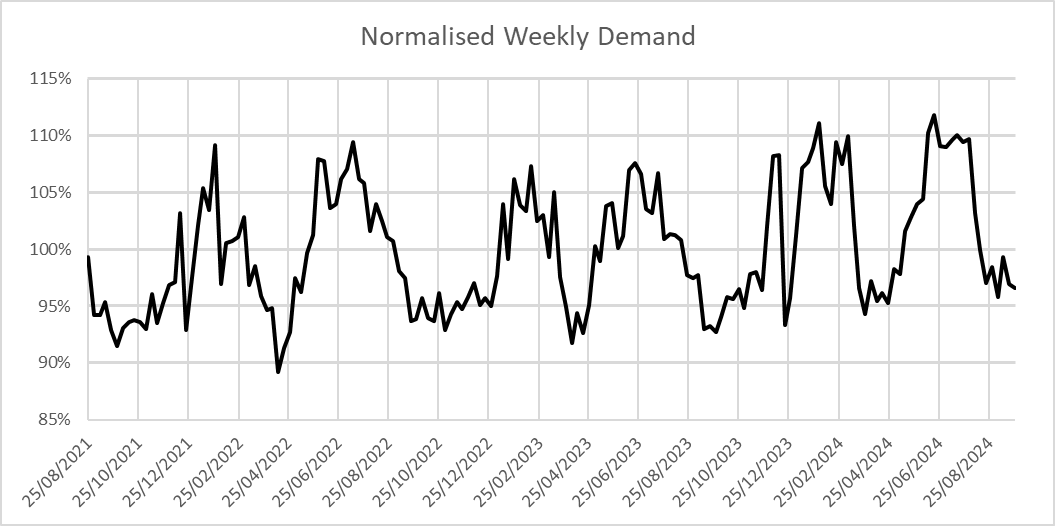
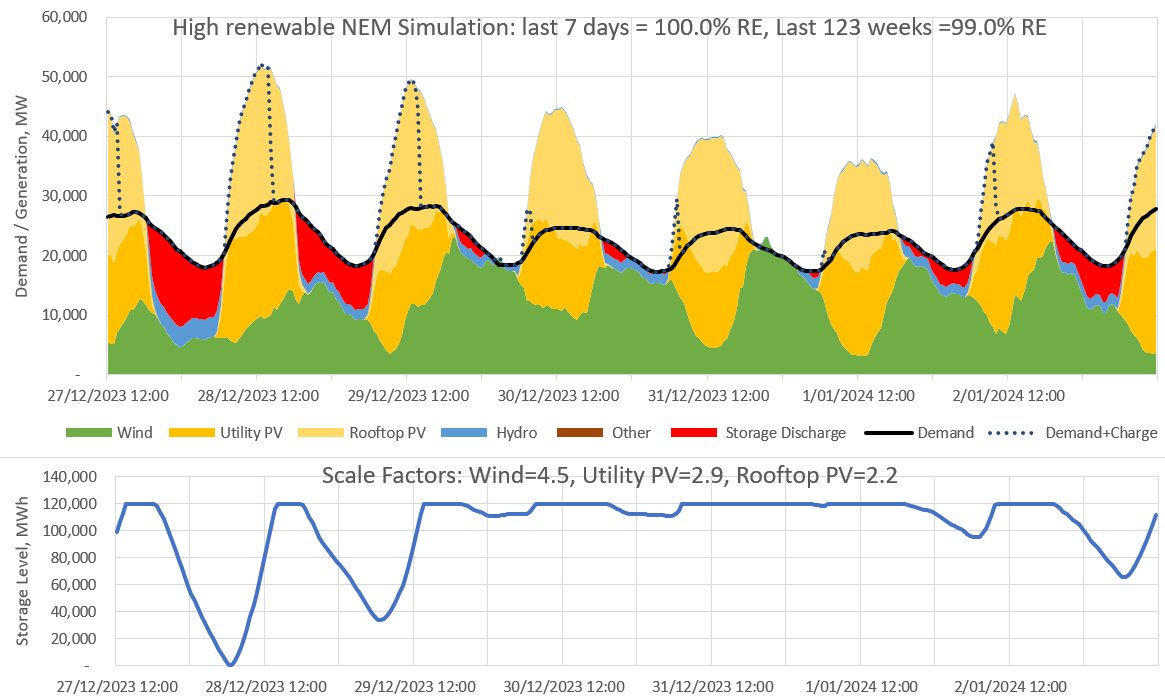
Demand is highly variable.
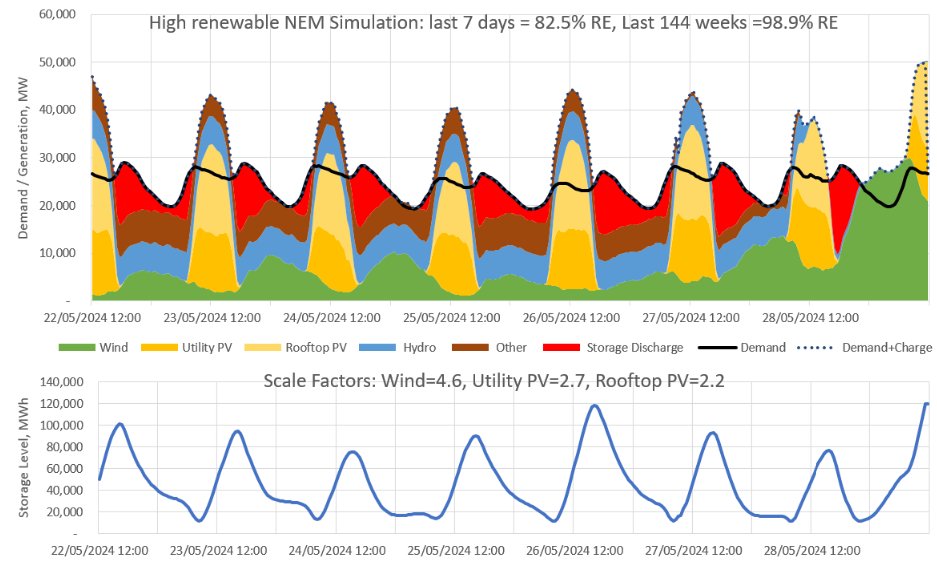
On the NEM average demand is ~24GW, but on a hot summer day, it can peak as high as 39GW.
Generators like coal (or nuclear) prefer to run at a near constant output, and are not suited to meeting these demand peaks.
/2

Dec 8, 2024 8 tweets 3 min read
Yes, if you add up all the annual costs in the ISP Step-Change scenario, you get to $692b (Real $2023). That includes $81b of emission costs.
That sounds a lot!
But what might a mostly nuclear scenario look like?
Short answer, it's likely to be much, much higher
1/n If previously made a thread on what the LNP nuclear policy might look like.
It involves a lot of gas & a lot of emissions to fill the gap before nuclear starts, optimistically in 2040!

2/n Image
Nov 6, 2024 5 tweets 3 min read
Thread: Each week I run a simulation of Australia’s main electricity grid using rescaled generation data to show that it can get very close to 100% renewable electricity with 24GW/120GWh of storage (5 hrs at av demand)
Results:
Last week: 100% RE
Last 167 weeks: 98.5% RE (1/n) Image Last week had:
- below average demand (97% of long-term average)
- average wind (102%)
- well above average solar (125%) (2/n) Image
Image
Oct 2, 2024 9 tweets 4 min read
There are good people advocating for nuclear in Australia.
Robert Parker isn't one of them.
He spreads misinformation about renewables & about the ISP.
His claims his proposed nuclear solution for the NEM is cheaper & cleaner than AEMO's ISP, but it is all based on lies.
/1 Robert claims his solution to be lower emissions compared to the ISP.
His solution has ~2,000 TWh of coal generation out to 2050.
The ISP has < 600 TWh.
The ISP has ~1/3 the total cumulative emissions out to 2050 compared to Robert's proposal.
/2 Image
Oct 2, 2024 5 tweets 3 min read
Thread: Each week I run a simulation of Australia’s main electricity grid using rescaled generation data to show that it can get very close to 100% renewable electricity with 24GW/120GWh of storage (5 hrs at av demand)
Results:
Last week: 100% RE
Last 162 weeks: 98.5% RE (1/n) Image 
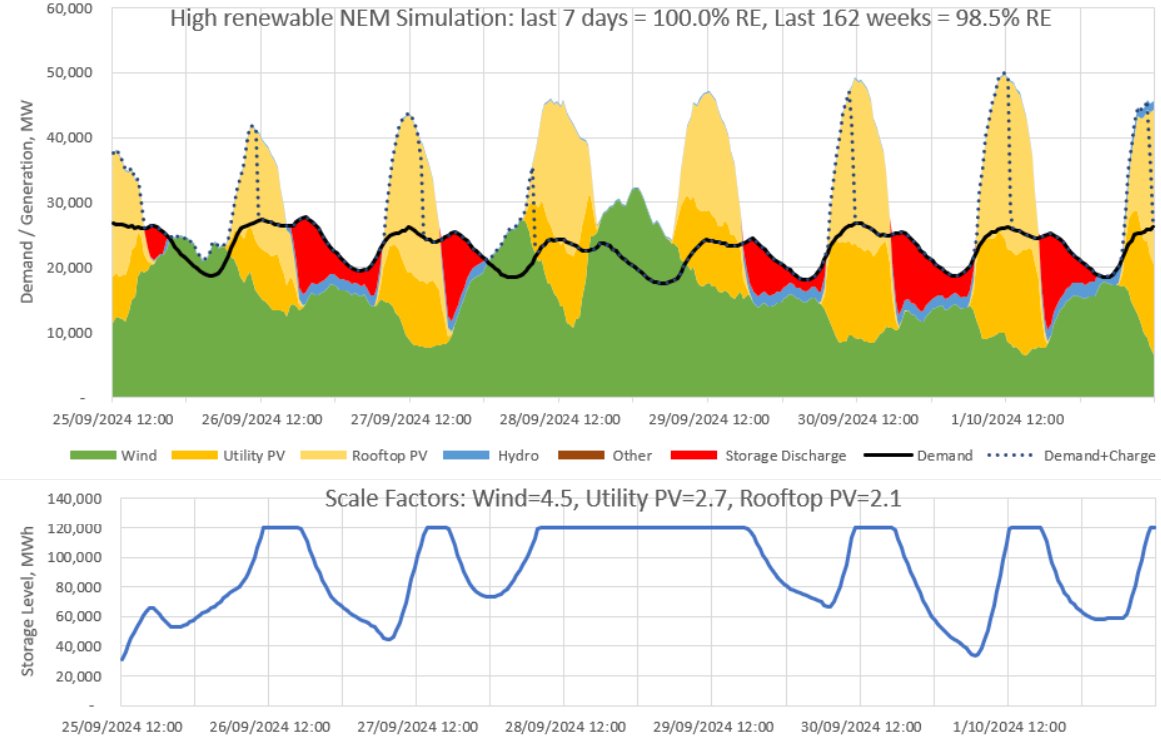
The week was marked by:
- below average demand (97% of long-term average)
- above average wind (112%)
- average solar (98%)
(2/n)
Image
Image
Jul 20, 2024 9 tweets 4 min read
The LNP nuclear policy is really a gas policy for the 2030s & 40s.
Coal is retiring before nuclear is ready.
The LNP want to slow the build of utility solar & wind
Gas will be required to fill the gap.
A lot of gas and a lot more emissions!
/1
Image
Image
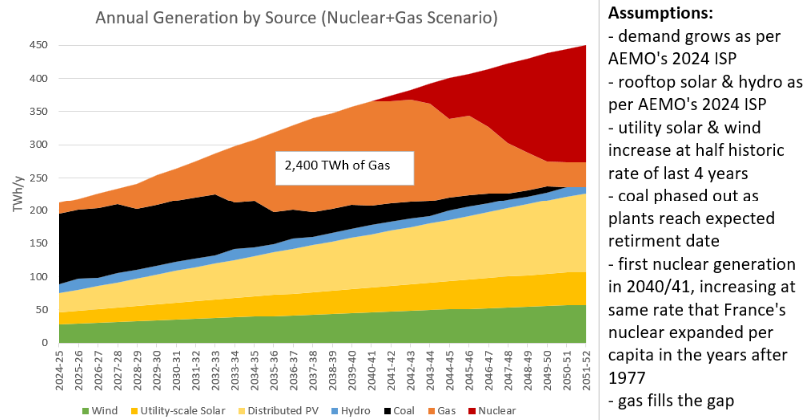
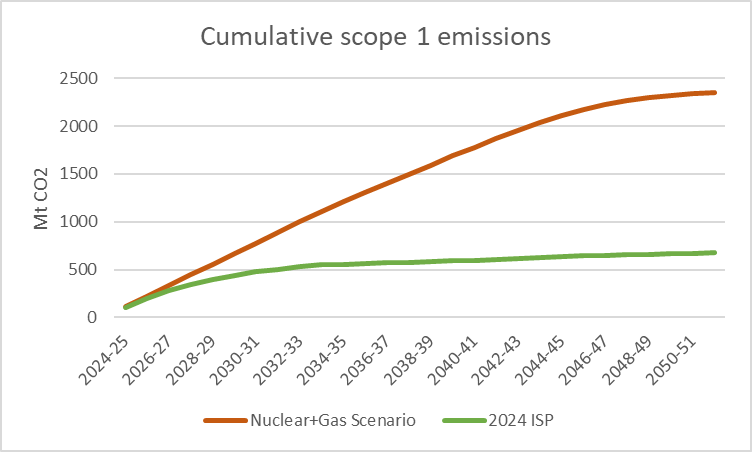
Ted O'Brien has admitted that the LNP nuclear plan will require a lot more gas.

This thread is an attempt to quantify how much more.
/2

Jul 15, 2024 22 tweets 6 min read
Great news last week, as Sth Australia locks in funds to fast-track its path to 100% net wind+solar.
Let’s do a deep dive into the ‘net’ aspect of this.
We'll also see if SA's emission intensity can get close to France's without the benefit of any hydro
/1

reneweconomy.com.au/south-australi… Since 2007, wind+solar generation in Sth Australia has increased from 1% to 71% of demand in 2023.
But some of the renewable supply was exported to Vic.
Gas and imports actually supplied 34% of demand in 2023.
/2 Image
May 29, 2024 7 tweets 4 min read
Thread: Each week I run a simulation of Australia’s main electricity grid using rescaled generation data to show that it can get very close to 100% renewable electricity with just 5 hrs of storage (24 GW / 120 GWh)
Results:
last week: 82.5% RE
last 144 weeks: 98.9% RE (1/n) Image 
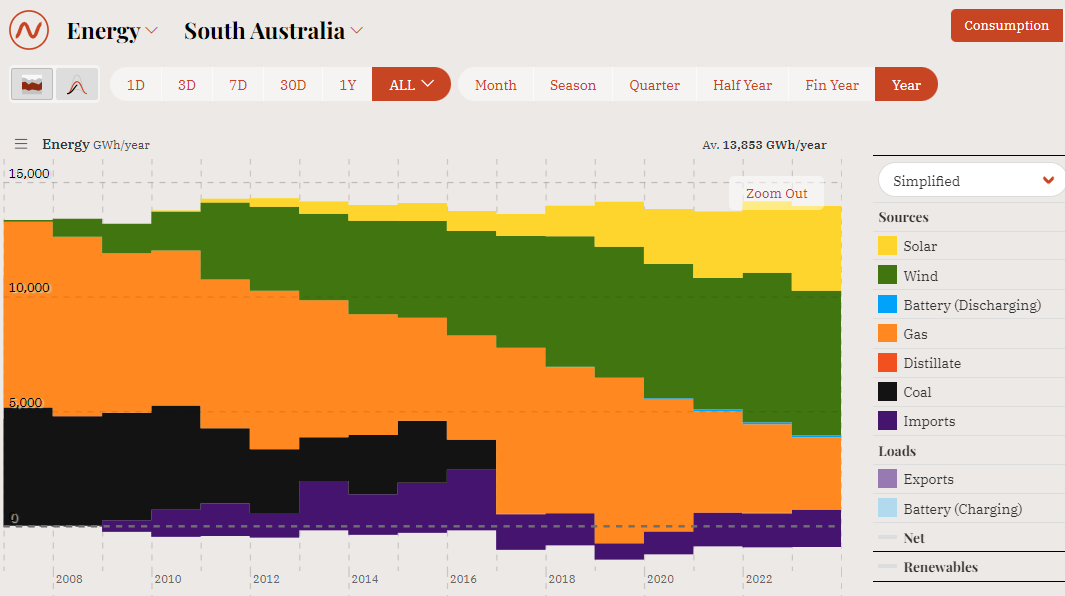
Here is the simulation from weeks 141 to 144. It was 92.4% renewable.
For earlier weeks, see the following thread (2/n)

Image
May 29, 2024 13 tweets 4 min read
A reminder to nuclear supporters. You can only have 2 of the following 3 things:
1. deep decarbonisation of electricity using mostly nuclear
2. no reliance on storage to manage variability of demand & supply
3. a nuclear fleet with high capacity factors
1/n
Many nuclear supporters have critisised Australia's CSIRO's latest GenCost report for modelling nuclear with capacity factors ranging from 53% to 89%. Many say they should instead assume CF>90% for nuclear.

2/n
Apr 10, 2024 5 tweets 3 min read
Thread: Each week I run a simulation of Australia’s main electricity grid using rescaled generation data to show that it can get very close to 100% renewable electricity with just 5 hrs of storage (24 GW / 120 GWh)
Results:
last week: 98.8% RE
last 137 weeks: 99.1% RE (1/5) Image 
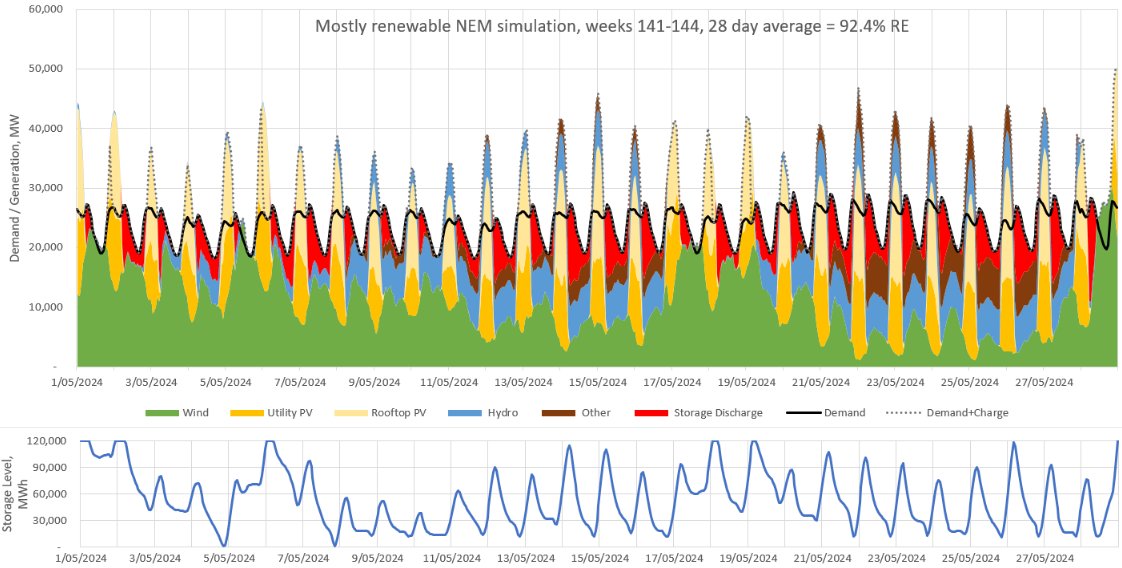
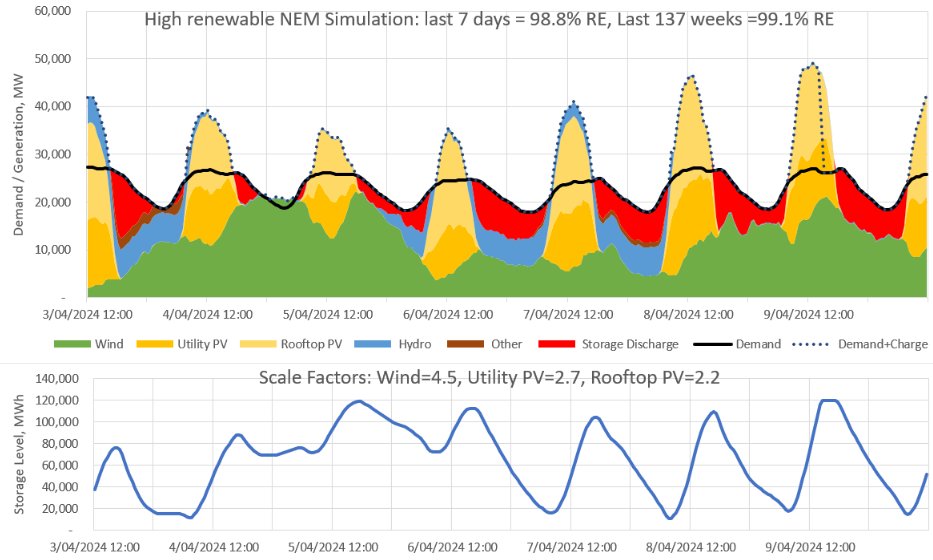
Here is the simulation from weeks 134 to 137. It was 99.7% renewable.
For earlier weeks, see the following thread (2/5)

Image
Apr 3, 2024 4 tweets 3 min read
Thread: Each week I run a simulation of Australia’s main electricity grid using rescaled generation data to show that it can get very close to 100% renewable electricity with just 5 hrs of storage (24 GW / 120 GWh)
Results:
last week: 100% RE
last 136 weeks: 99.1% RE (1/4) Image 
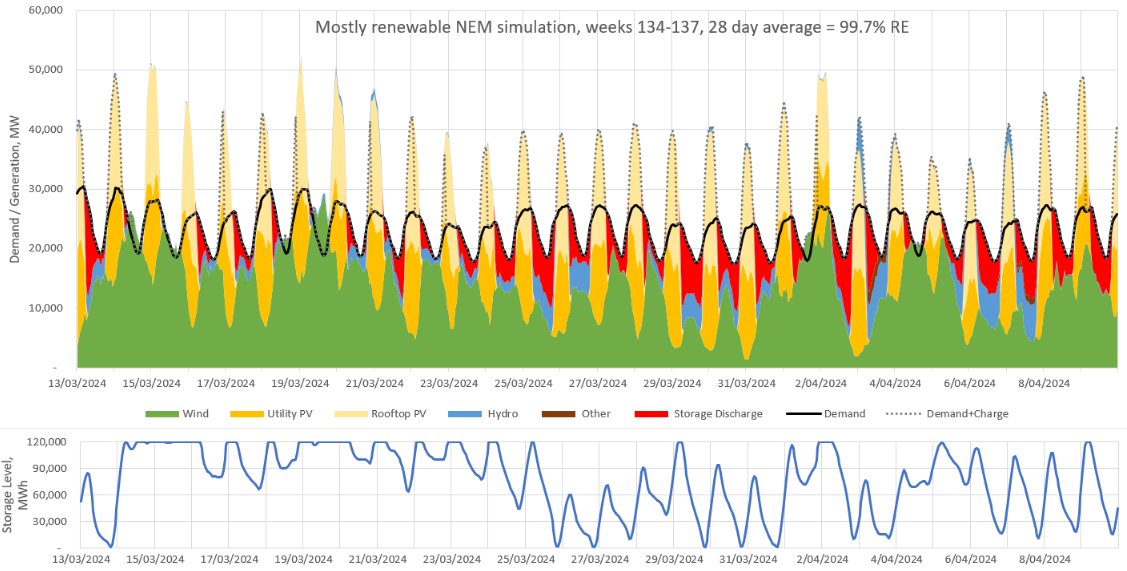
Here is the simulation from weeks 133 to 136. It was 100% renewable.
For earlier weeks, see the following thread (2/4)

Image
Feb 26, 2024 11 tweets 5 min read
How much does distributed rooftop PV reduce peak demand & how much might rooftop PV & distributed batteries reduce it in the future?
Analysis using Australia's NEM data from the last year suggests ~13% for current rooftop PV, ~14% for future PV & 22% for future PV+batteries (1/n) Image 
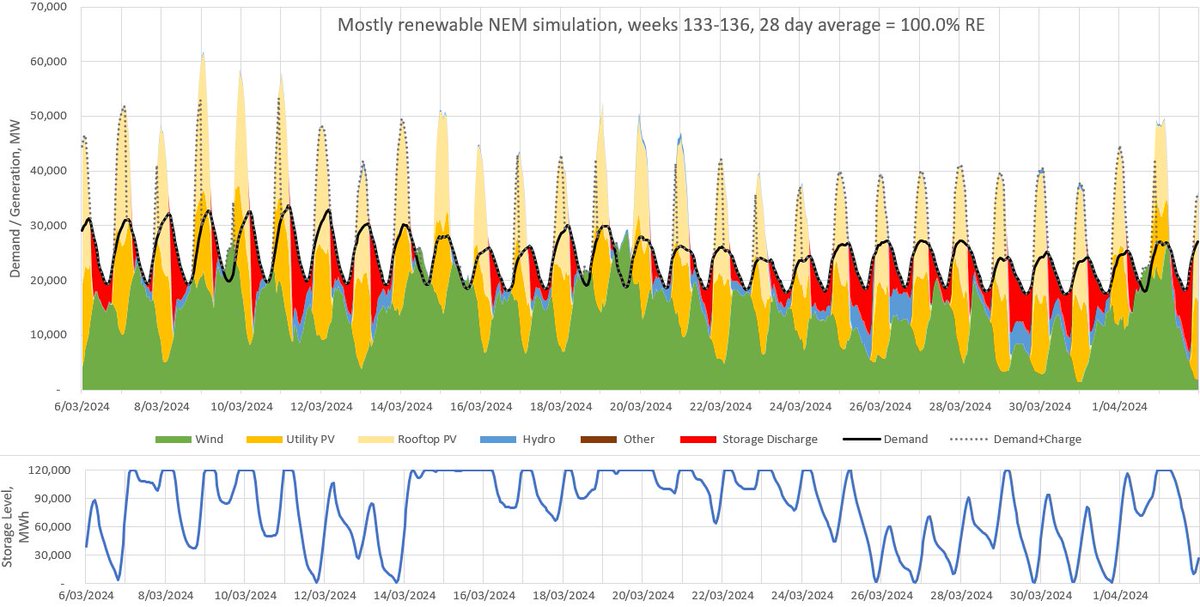
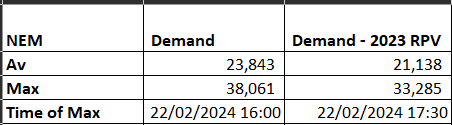
Last week, on 22 Feb NEM demand set an all time record of 38 GW. At the time rooftp PV was providing over 7 GW, greatly reducing peak grid demand, which instead occured 90 minutes later at ~33.3 GW, a 13% reduction (2/n)


Image
Image
Feb 4, 2024 6 tweets 2 min read
The new Australian car efficiency standard.
A good start to incentivise increasing efficiency.
But they don't appear to incentivise manufacturers to sell smaller cars.
The heavier and more light commercial vehicles they sell, the greater the emission allowance.
Image
Image
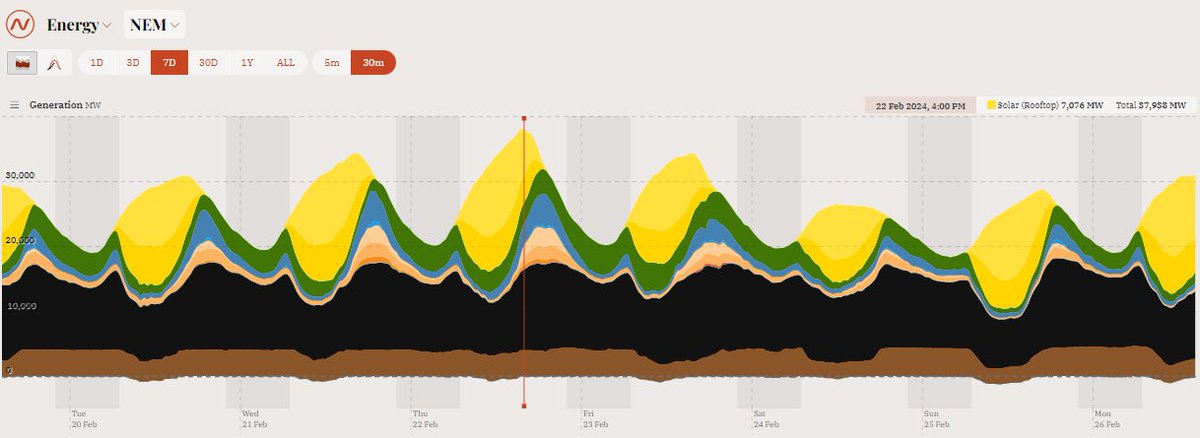
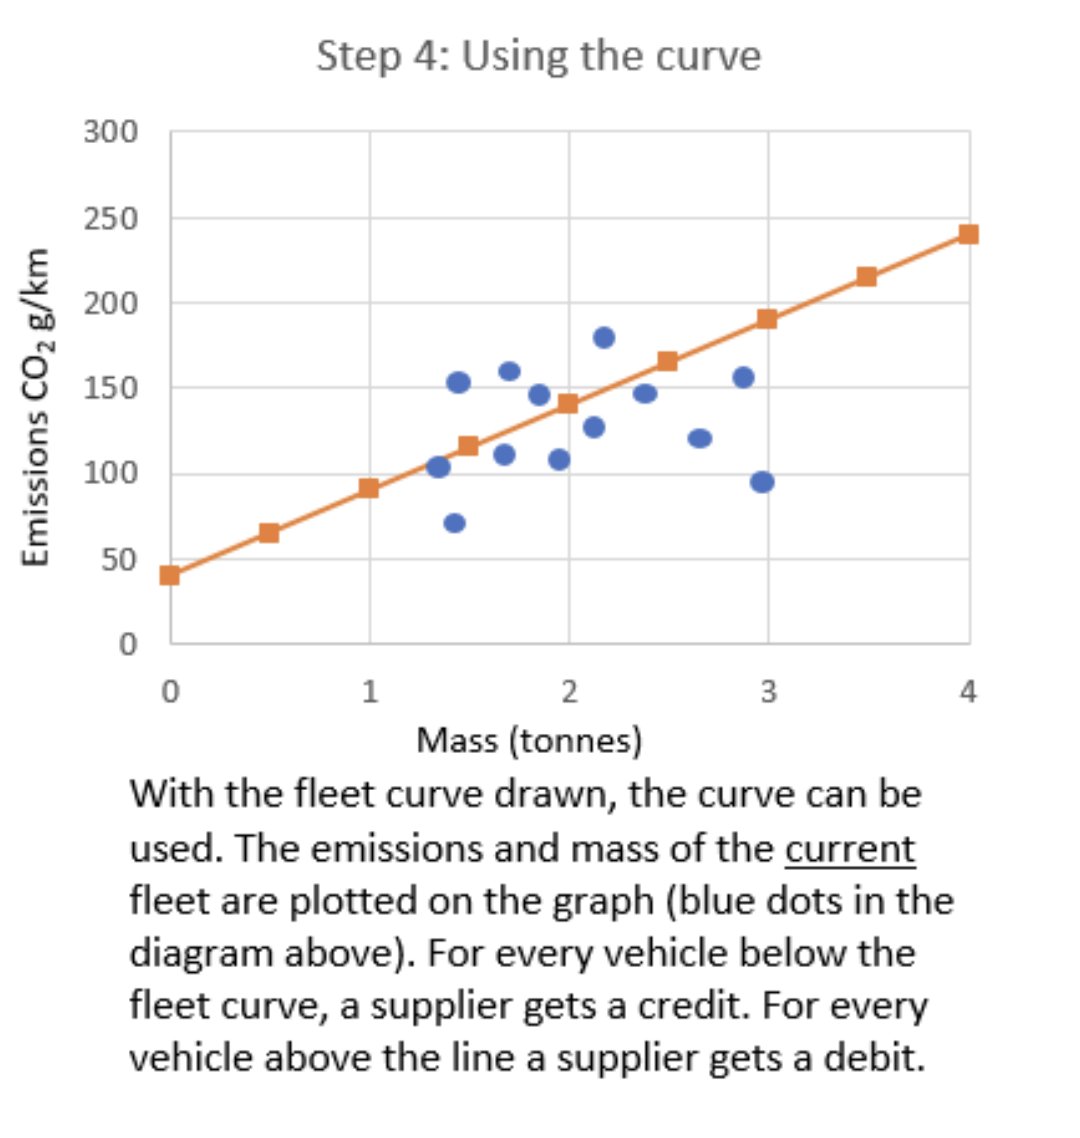
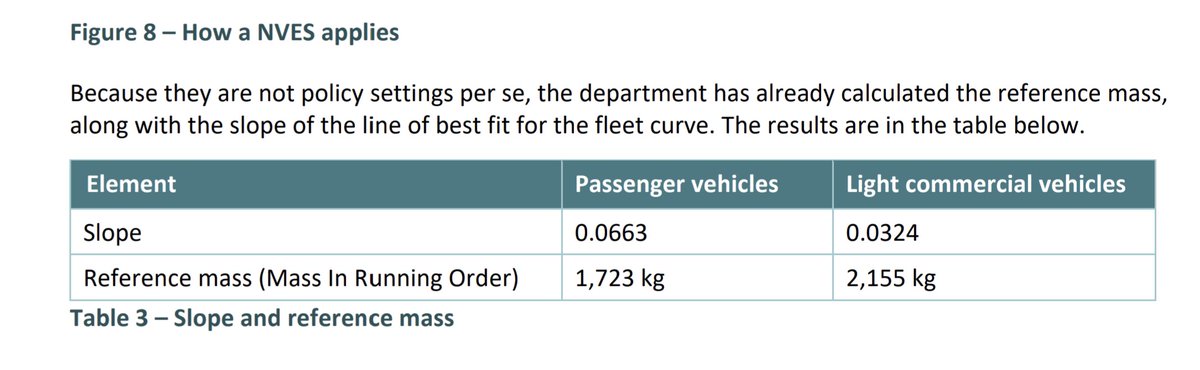
In the US much of the improvement in car fuel efficiency has been offset by the increase in vehicle mass. Australia should learn from this.
its.ucdavis.edu/blog-post/putt…
Image
Jan 3, 2024 4 tweets 2 min read
Thread: Each week I run a simulation of Australia’s main electricity grid using rescaled generation data to show that it can get very close to 100% renewable electricity with just 5 hrs of storage (24 GW / 120 GWh)
Results:
last week: 100% RE
last 123 weeks: 99.0% RE (1/4) Image 
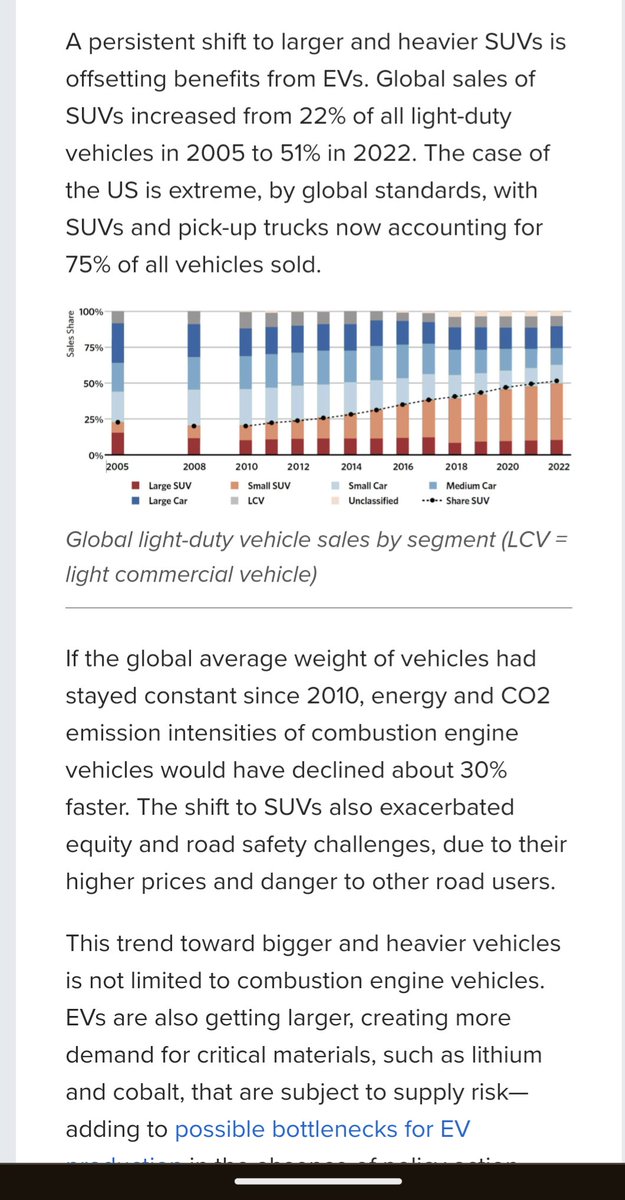
Here is the simulation from weeks 120 to 123. It was 100% renewable.
For earlier weeks, see the following thread (2/4)

Image
Jan 2, 2024 4 tweets 2 min read
Electricity emissions reducing in Australia thanks to increasing generation from wind & solar, though still much work to do.
SA leading the way with a 70% reduction in emission intensity over the last 15 years & a 38% reduction in just the last 5 years. Data: @OpenNem (1/4)

Image
Image
Image
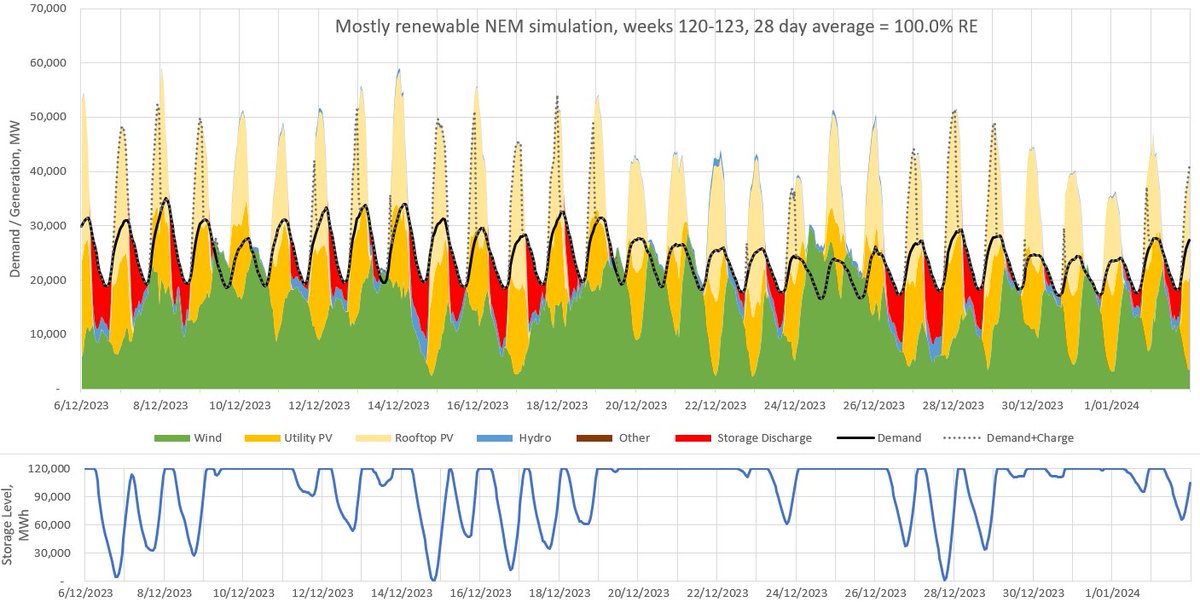
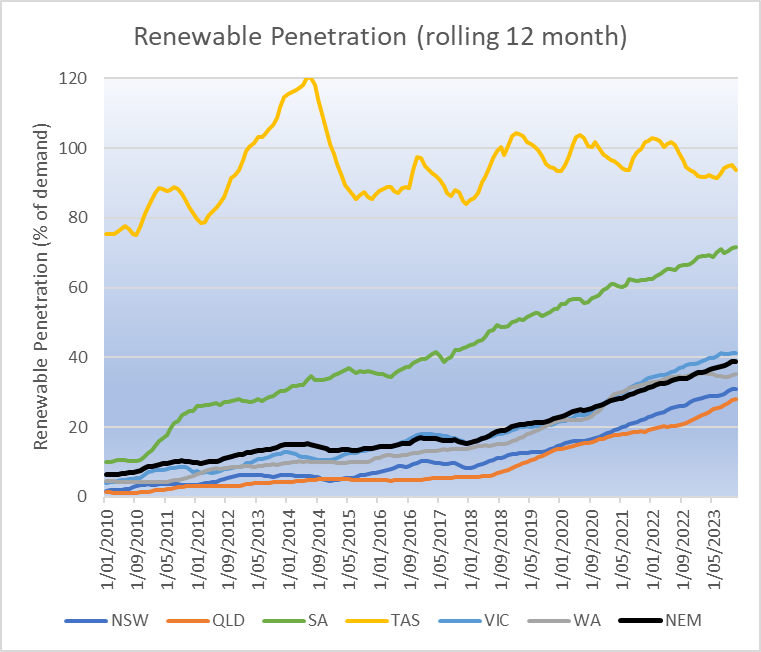
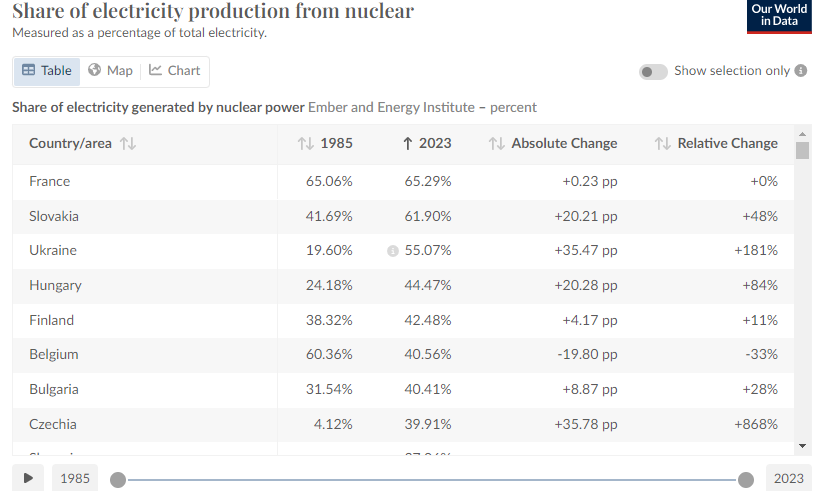
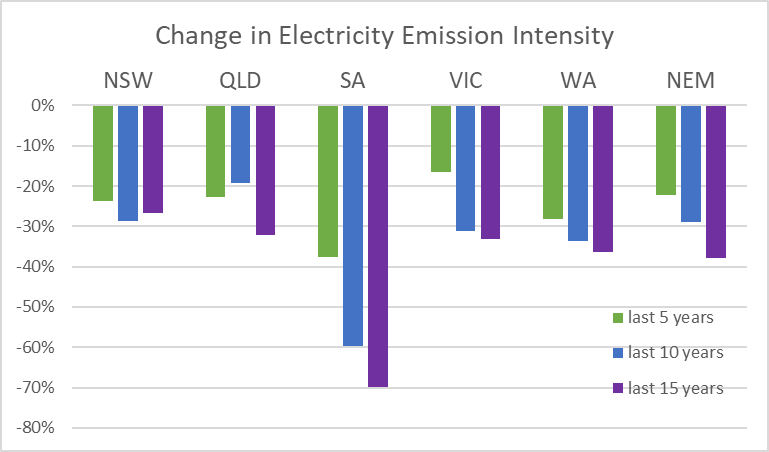
The increase in wind & solar penetration in SA over the last 15 years is comparable to the increase in nuclear generation in France during the 1970s/80s.
Note: graph is % of generation. I'd prefer to show % of demand, but I don't have historical import/export data for FRA (2/4) Image
Dec 20, 2023 4 tweets 2 min read
Thread: Each week I run a simulation of Australia’s main electricity grid using rescaled generation data to show that it can get very close to 100% renewable electricity with just 5 hrs of storage (24 GW / 120 GWh)
Results:
last week: 100% RE
last 121 weeks: 99.0% RE (1/4) Image 
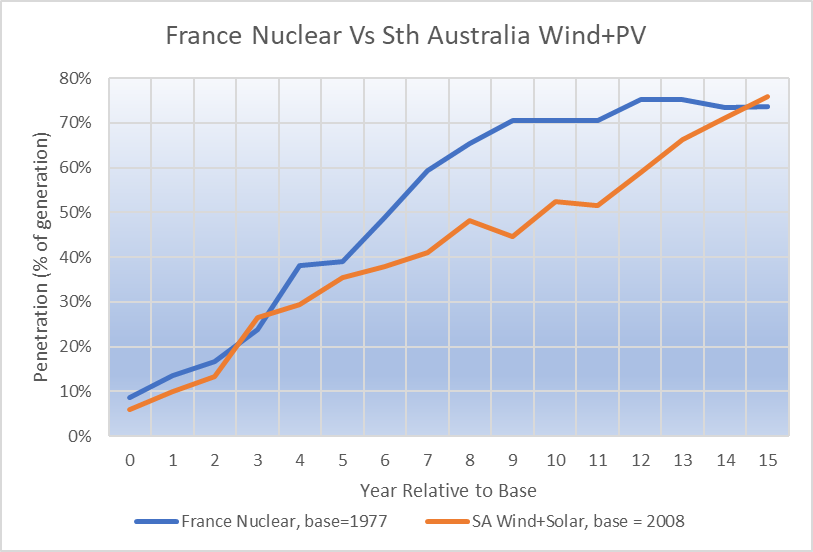
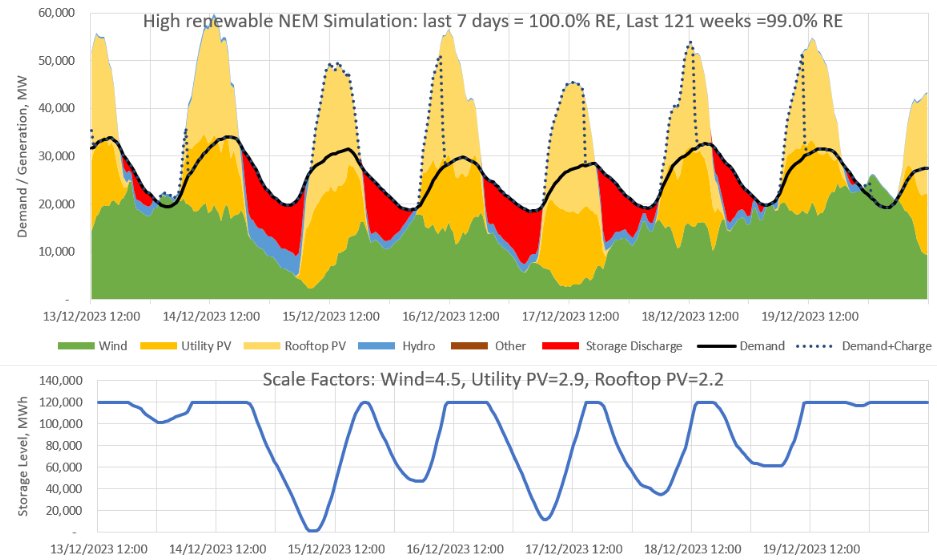
Here is the simulation from weeks 118 to 121. It was 100% renewable.
For earlier weeks, see the following thread (2/4)

Image
Nov 29, 2023 4 tweets 2 min read
Thread: Each week I run a simulation of Australia’s main electricity grid using rescaled generation data to show that it can get very close to 100% renewable electricity with just 5 hrs of storage (24 GW / 120 GWh)
Results:
last week: 100% RE
last 118 weeks: 99.0% RE (1/4) Image 
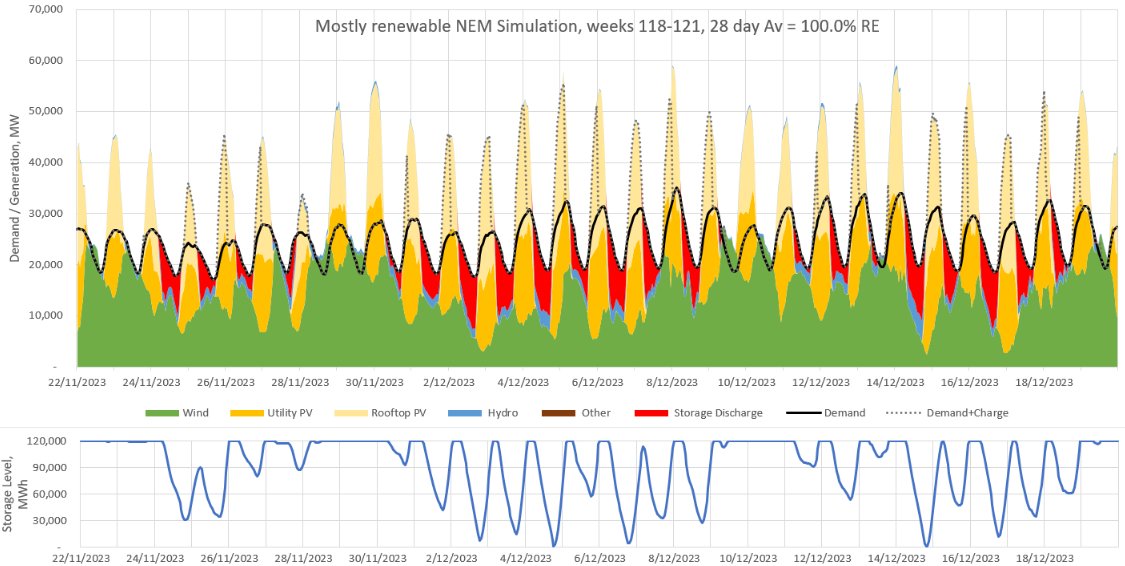
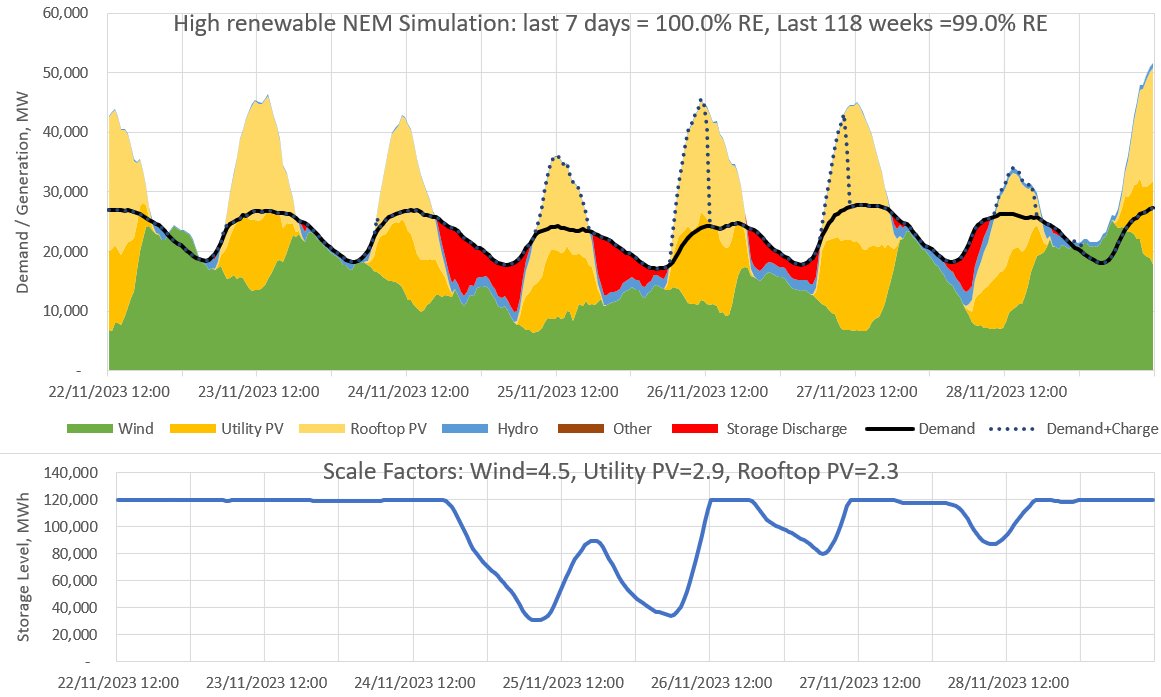
Here is the simulation from weeks 115 to 118. It was 100% renewable.
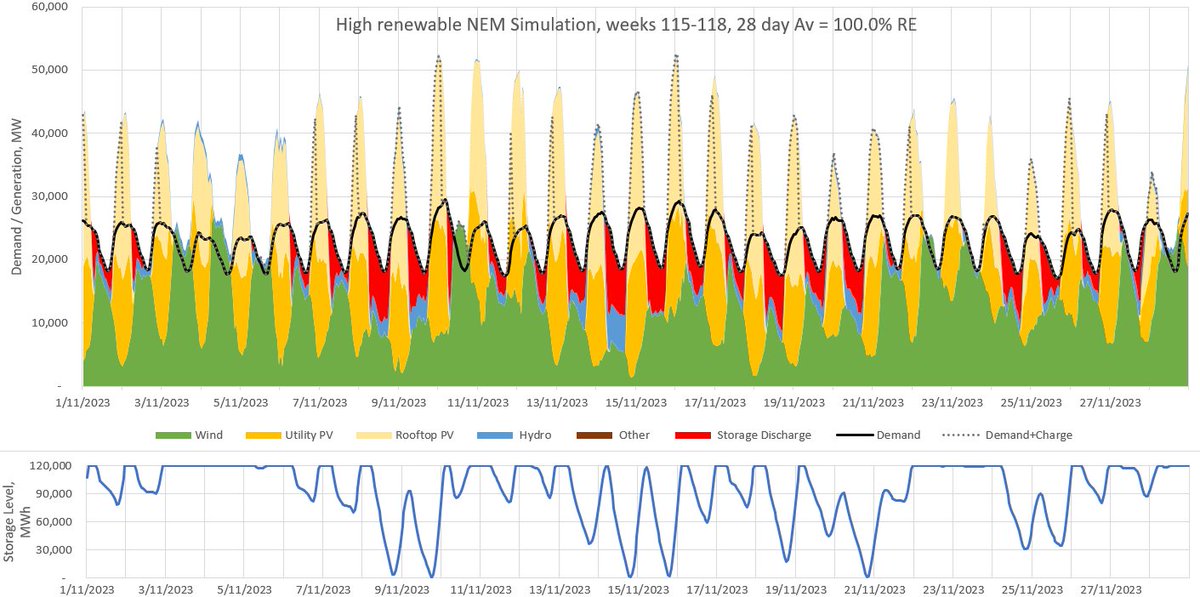
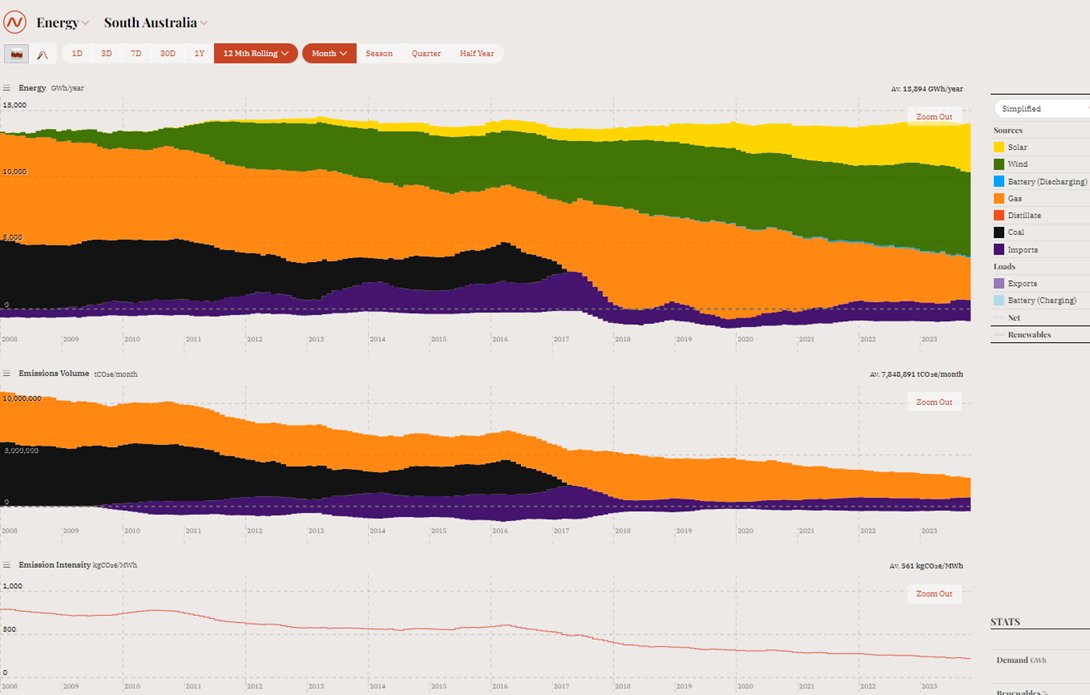
For earlier weeks, see the following thread (2/4)

Image
Oct 25, 2023 4 tweets 2 min read
Thread: Each week I run a simulation of Australia’s main electricity grid using rescaled generation data to show that it can get very close to 100% renewable electricity with just 5 hrs of storage (24 GW / 120 GWh)
Results:
last week: 100% RE
last 113 weeks: 98.9% RE (1/4) Image 
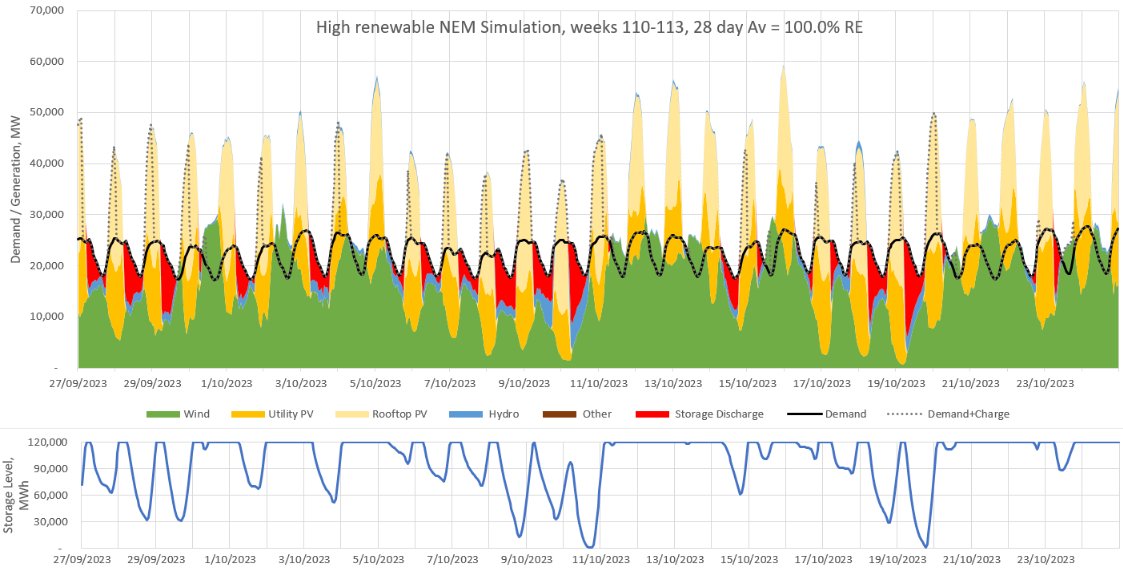
Here is the simulation from weeks 110 to 113. It was 100% renewable.
For earlier weeks, see the following thread (2/4)

Image
Oct 16, 2023 5 tweets 2 min read
A thread about Australia’s hydro generating assets & how they can greatly help Australia get very close to 100% renewable electricity.

I’ve previously tweeted about how hydro can balance wind & solar on a daily basis (1/n)
But hydro is also useful for balancing renewables on a seasonal & yearly basis.
Our dams store ~2 TWh of excess inflows from May-Oct & release them in Nov-Apr.
In FY2013 & 14, hydro generated 6.5 TWh more than inflows to take advantage of high prices during the carbon tax (2/n)
Image
Image
Sep 6, 2023 4 tweets 2 min read
Thread: Each week I run a simulation of Australia’s main electricity grid using rescaled generation data to show that it can get very close to 100% renewable electricity with just 5 hrs of storage (24 GW / 120 GWh)
Results:
last week: 99.7% RE
last 106 weeks: 98.9% RE (1/4) Image Here is the simulation from weeks 103 to 106. It was 98.1% renewable.
For earlier weeks, see the following thread (2/4)

Image
Sep 1, 2023 27 tweets 11 min read
Updated thread containing more information, FAQs, price & emission information about my weekly high renewable simulations. Much of this information is also contained in this article, which I wrote when I’d reached 2 years of simulations (1/n)
reneweconomy.com.au/a-near-100pct-… What is ‘Other’?
In the short-term it is likely to be existing gas/diesel peaking generators (the NEM currently has ~11 GW of these). Longer term “other” could be flexible demand, biofuel or green hydrogen powered generators, and/or long-term storage such as Snowy 2.0. (2/n) Image