
This thread goes in detail about how I use inverse FVGs
Personally, I think this is the best possible model one can have with ICT, and you can have a very high win rate with it
Read carefully💎#ICT
Personally, I think this is the best possible model one can have with ICT, and you can have a very high win rate with it
Read carefully💎#ICT
Before I start, I just want to say I use inverses with ES, NQ, YM, Oil, Gold, and EUR/USD everyday in my livestreams and can confidently say they work well on all of them
The other thing, join my discord before you forget and lmk if you have any questions, I do free live streams once every week or two. If you are interested I have a free 7 day trial for my patreon where I live stream EVERY day and call and teach live. DM me discord.gg/G6YWA7ahJH
It is important to know where the draw on liquidity is when using inverse FVGs, so make sure you have an okay understanding on that
Thread on DOL will be linked under this tweet
Thread on DOL will be linked under this tweet
So, all an inverse FVG is, is when a bearish or bullish FVG get traded through / violated meaning there’s a candle close above or above them
If the DOL is bullish for ES, and a bearish FVG gets closed above, we can say it’s been violated and we should push higher, like this:
If the DOL is bullish for ES, and a bearish FVG gets closed above, we can say it’s been violated and we should push higher, like this:

So basically, I am using an already normal bearish FVG to tell me the draw is higher once we closed above it.
Bodies tell the story
Wicks do the damage
Bodies tell the story
Wicks do the damage
The first thing I think is important if you want the simplest inverse FVG model, is only use them when there is only ONE of them in the same leg, not 2 or more
I still use them with 2 or more FVGs in the same leg, but you need more screen time to determine rules regarding this
I still use them with 2 or more FVGs in the same leg, but you need more screen time to determine rules regarding this
In the first example, you can see there is only 1 FVG in the leg
In the second example you can see there’s a lot more than just 1
Like I said, first example with 1 will be much more straightforward and easier to form
In the second example you can see there’s a lot more than just 1
Like I said, first example with 1 will be much more straightforward and easier to form


Sometimes, if you see 2 or more, like in the first example, you can go to the higher time frame and make it 1, like this:
Sometimes when you do this, there’s no FVG on the higher time frame so in that case I would not try using it as an inverse
Sometimes when you do this, there’s no FVG on the higher time frame so in that case I would not try using it as an inverse


Once we see us combine these two FVGs into 1, we can confidently say with the LRLR above, and the bullish narrative, it should hold as support once the body closes above


So when you see that close above, your goal is to long when we retrace back into the old bearish FVG (now an inverse)
And then you target the next major high or EQH
Stop loss is always a close back below the inverse
And then you target the next major high or EQH
Stop loss is always a close back below the inverse

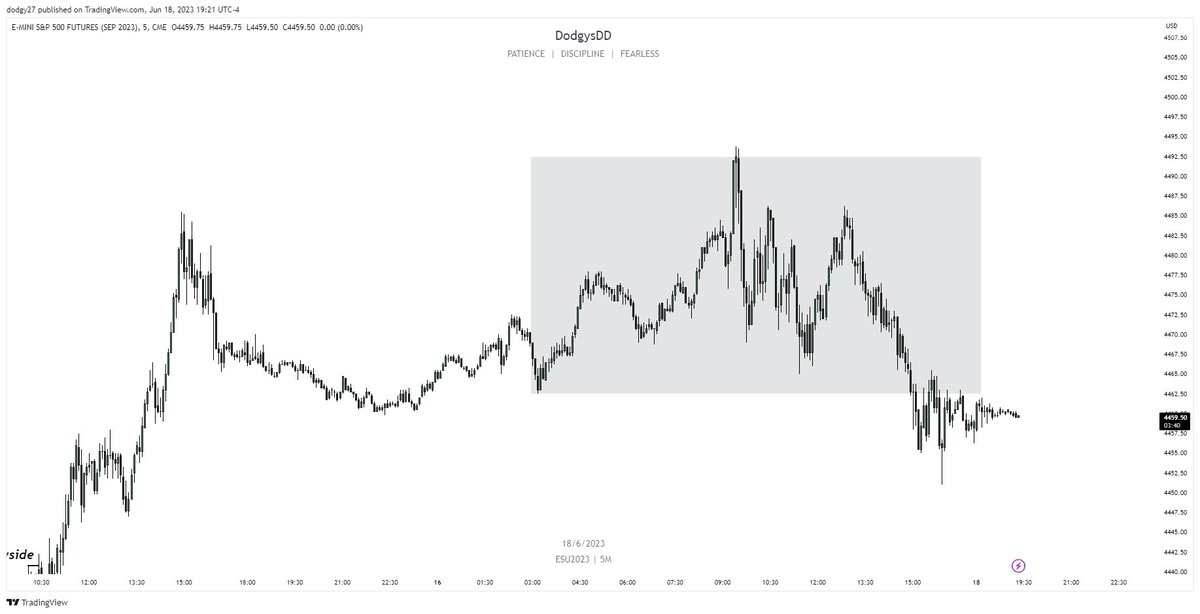
Another thing you should note: Using inverse on the 1 min when price is very bullish (and vice versa), is not the greatest… look at this example:

I like to wait until orderflow starts to go back neutral (sideways) or changes completely instead of trying to short a strong trend on the first inverse we get
In this example, after a giant trend going up, you start to see price neutralize a bit, meaning the bullish PD arrays start to get disrespected a few more times than once, so this is what price should look like when inverses will be the best
Last example, once you start to see more neutral price action, you can see after we broke sturcture to the downside here, this inverse works perfectly.

If you look closer,the second bullish FVG never got retested, but acts as an inverse as well. Inverses work best in context, because there’s equal lows below and that’s the draw, the bullish FVG should accelerate price downwards through it whether it’s retested or not
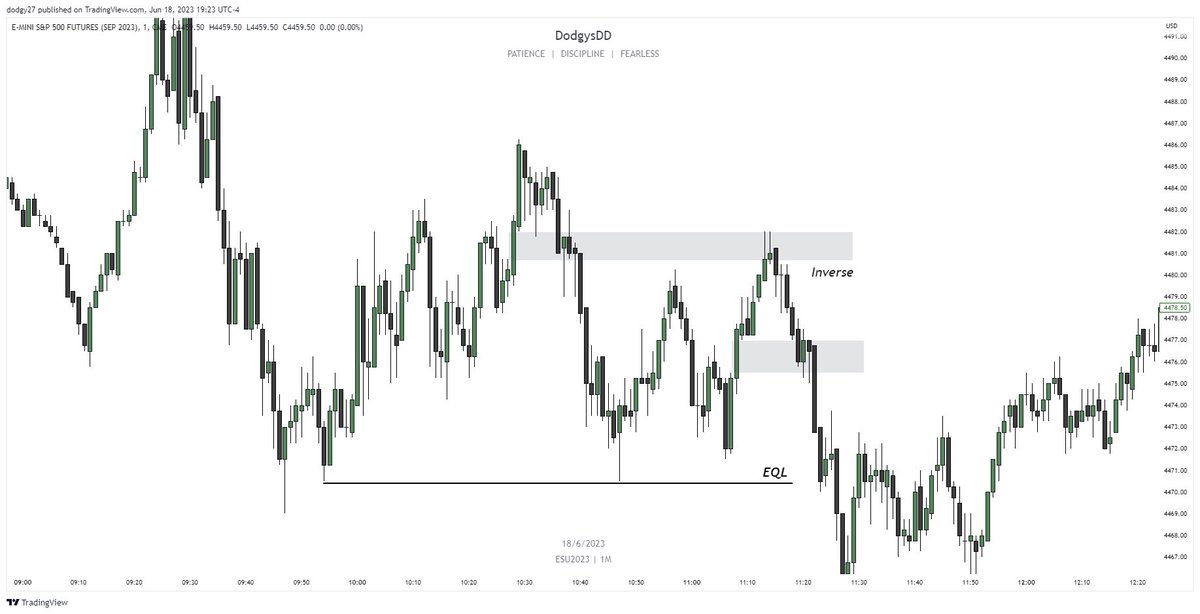
If the bullish FVG was not there, it would have been a riskier short.
That’s it for now. Go subscribe to my YouTube where I post a ton of my livestreams and content on inverses and other ICT concepts :)
youtube.com/@DodgysDDs
youtube.com/@DodgysDDs
• • •
Missing some Tweet in this thread? You can try to
force a refresh


