Manchester City biggest Premier League income generator in 21/22. Manchester United still a long way ahead of the pack over the 30 yrs of the PL. Income £300m higher overall than previous record. 

Matchday income headed by Manchester United for 30th consecutive year. Spurs have capacity to overtake but would need a few more cup matches. Matchday 13.7% of total income. 

Broadcast income £2.97 billion in 21/22. Lower than previous season in which many clubs played 44 PL games in period 1 July to 30 June in their financial year and so 20/21 figs distorted. Liverpool reaching CL final means they topped the table. 

Manchester City became first club to generate over £300m from commercial income in a season. To put into context City made more commercial income in one season than NUFC did in the whole Mike Ashley era 

Main costs for clubs are player based. Manchester United top wage table due to signing of you know who, as their wage bill increased by £61m. Big 👏to Brentford for not just getting up but staying up on average wage of £31k a week. 


Other player cost is amortisation (transfer fee spread over contract length). Chelsea by far in front and that's before the big spend (albeit over long contracts) under Boehly. 

Cleaned EBIT profit is total income less recurring expenses, so excludes one off events (redundancy, debt write offs, impairments, player sale profits etc). Total losses £842m, compared to £957m and £1,291m in previous two seasons. 

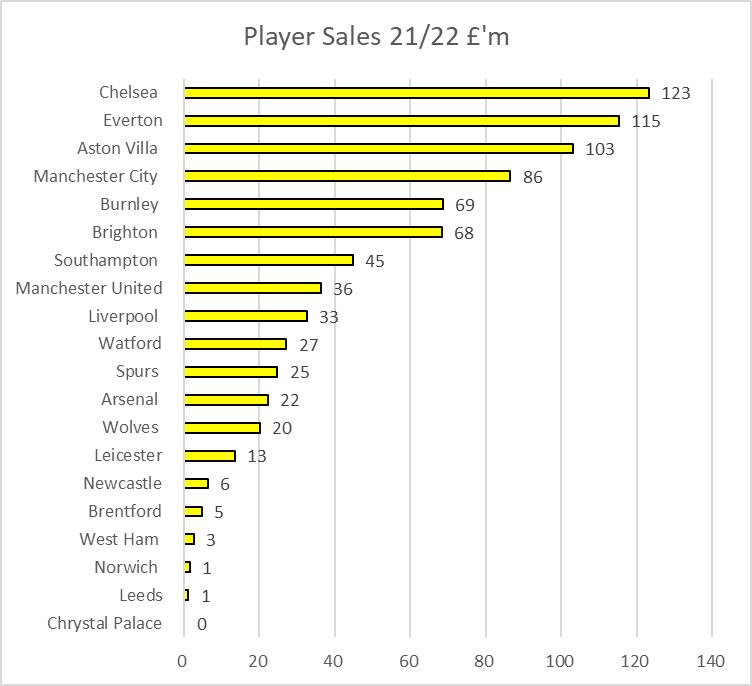
Losses can be reduced by player sale profits. Chelsea once again the most successful team in this area due to Tomori and Abrahams, Villa second due to Sir Jack of Grealish. 

Net interest costs for PL in 21/22 were £194m, of which half was in relation to #MUFC and #THFC. Total interest costs under the Glazers now £917m 

Taking into account player sales, interest and one off transactions gives overall loss before tax of £524m compares to £752m in 2021 and £993m in 2020 

Total player spend by PL clubs in 2021/22 was £1.89 billion. Could see the £2bn barrier being broken in 22/23. Remember signings are relate to the financial year which is usually 31 May or 30 June 

Many transfers are on instalment bases. PL clubs owed £1,867m and were only due to recover £800m from player sales. 


Total borrowings of PL clubs at end of 21/22 were £4.1 billion. Would have been higher but Chelsea sale meant £1.5bn due to Abramovich written off. UEFA use a metric called football net debt which is borrowings + transfer fees payable less cash less transfer fees receivable. 


At executive level Chelsea paid £35m to Marina G for assisting in the sale of the club, other directors seeing rises, but still most CEO's paid less than first team players 

• • •
Missing some Tweet in this thread? You can try to
force a refresh

 Read on Twitter


